Working Paper
Inference Based on Scale, Label, and Economic Restrictions
WP 26-36 – The results of nearly 100 prominent studies in empirical macroeconomics have been called into question by Baumeister and Hamilton (2018).
Featured Work
Working Paper
The Health Channel of Business Cycles
WP 26-32 – We document that economic contractions causally worsen health among working-age adults and that poor health predicts negative labor market outcomes. These findings reveal a health channel of business cycles.
Working Paper
Pricing-to-Market in Business Cycle Models
WP 26-31 – We evaluate several leading microfounded pricing-to-market (PTM) mechanisms embedded in a two-country DSGE model with volatile exchange rates driven by real and financial shocks.
Working Paper
Large SVARs
WP 26-04/R – We develop a new algorithm to analyze economic data using SVAR models identified with sign restrictions. We demonstrate its usefulness on a small SVAR of the world oil market and a large SVAR of the U.S. economy.
Featured Data

Livingston Survey
The oldest continuous survey of economists' expectations that summarizes the forecasts of economists from industry, government, banking, and academia
Updated: 24 Jun ’26

Survey of Professional Forecasters
The oldest quarterly survey of macroeconomic forecasts in the United States
Updated: 15 May ’26
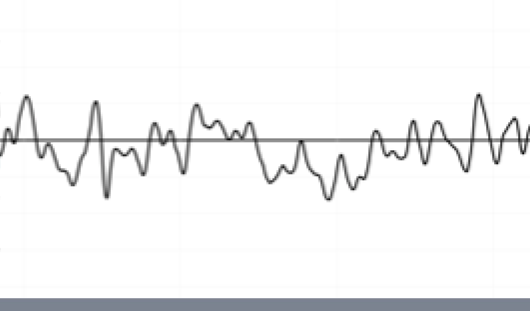
Aruoba-Diebold-Scotti Business Conditions Index
An index designed to track real business conditions at high observation frequency
Updated: 30 Jul ’26
Real-Time Data Set for Macroeconomists
The real-time data set consists of vintages, or snapshots, of time series of major macroeconomic variables. The data set may be used by macroeconomic researchers to verify empirical results, to analyze policy, or to forecast. All data are updated at the end of each month.
Updated: 31 Jul ’26
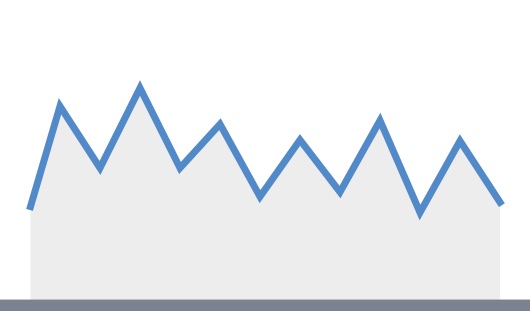
GDPplus
Measure of the quarter-over-quarter rate of growth of real output in continuously compounded annualized percentage points
Updated: 30 Jul ’26
Aruoba Term Structure of Inflation Expectations
A continuous curve of inflation expectations three to 120 months ahead, analogous to a yield curve
Updated: 31 Jul ’26