Fourth Quarter 2026 Survey of Professional Forecasters
Forecasters Maintain Their Predictions for Near-Term Growth
The near-term outlook for the U.S. economy looks nearly unchanged from three months ago, according to 32 forecasters surveyed by the Federal Reserve Bank of Philadelphia. The forecasters predict the economy will expand at an annual rate of 2.3 percent this quarter and 2.1 percent next quarter, unchanged from the predictions in the last survey. On an annual-average over annual-average basis, the panel predicts real GDP will grow between 2.1 percent and 2.4 percent from 2026 to 2029.
A small downward revision to the path for the unemployment rate accompanies the outlook for growth. The forecasters predict the unemployment rate will range from 4.2 percent to 4.3 percent from this quarter through the third quarter of 2027. In the previous survey, the unemployment rate was forecast to remain unchanged at 4.3 percent over the same period. On an annual-average basis, the forecasters expect the unemployment rate to average from 4.2 percent to 4.3 percent over each of the next four years, essentially unchanged from the previous estimates.
On the employment front, the forecasters predict job gains in the current quarter at a rate of 90,000 per month, which is higher than the previous estimate of 66,400. However, the projections for job gains in the next three quarters are lower than their predictions in the last survey. The projections for the annual-average level of nonfarm payroll employment suggest job gains at a monthly rate of 39,300 in 2026 and 62,800 in 2027, both lower than the previous estimates. (These annual-average projections are computed as the year-to-year change in the annual-average level of nonfarm payroll employment, converted to a monthly rate.)
Median Forecasts for Selected Variables in the Current and Previous Surveys
| Real GDP (%) | Unemployment Rate (%) | Payrolls (000s/month) | |||||||
|---|---|---|---|---|---|---|---|---|---|
| Previous | New | Previous | New | Previous | New | ||||
| Quarterly data: | |||||||||
| 2026:Q4 | 2.3 | 2.3 | 4.3 | 4.2 | 66.4 | 90.0 | |||
| 2027:Q1 | 2.1 | 2.1 | 4.3 | 4.2 | 94.9 | 65.0 | |||
| 2027:Q2 | 2.1 | 2.2 | 4.3 | 4.2 | 80.4 | 49.3 | |||
| 2027:Q3 | 2.2 | 2.2 | 4.3 | 4.3 | 56.2 | 51.0 | |||
| 2027:Q4 | N.A. | 2.1 | N.A. | 4.3 | N.A. | 51.3 | |||
| Annual data (projections are based on annual-average levels): | |||||||||
| 2026 | 2.1 | 2.4 | 4.3 | 4.2 | 40.7 | 39.3 | |||
| 2027 | 2.2 | 2.3 | 4.3 | 4.3 | 75.4 | 62.8 | |||
| 2028 | 2.1 | 2.1 | 4.2 | 4.2 | N.A. | N.A. | |||
| 2029 | 2.4 | 2.2 | 4.3 | 4.3 | N.A. | N.A. | |||
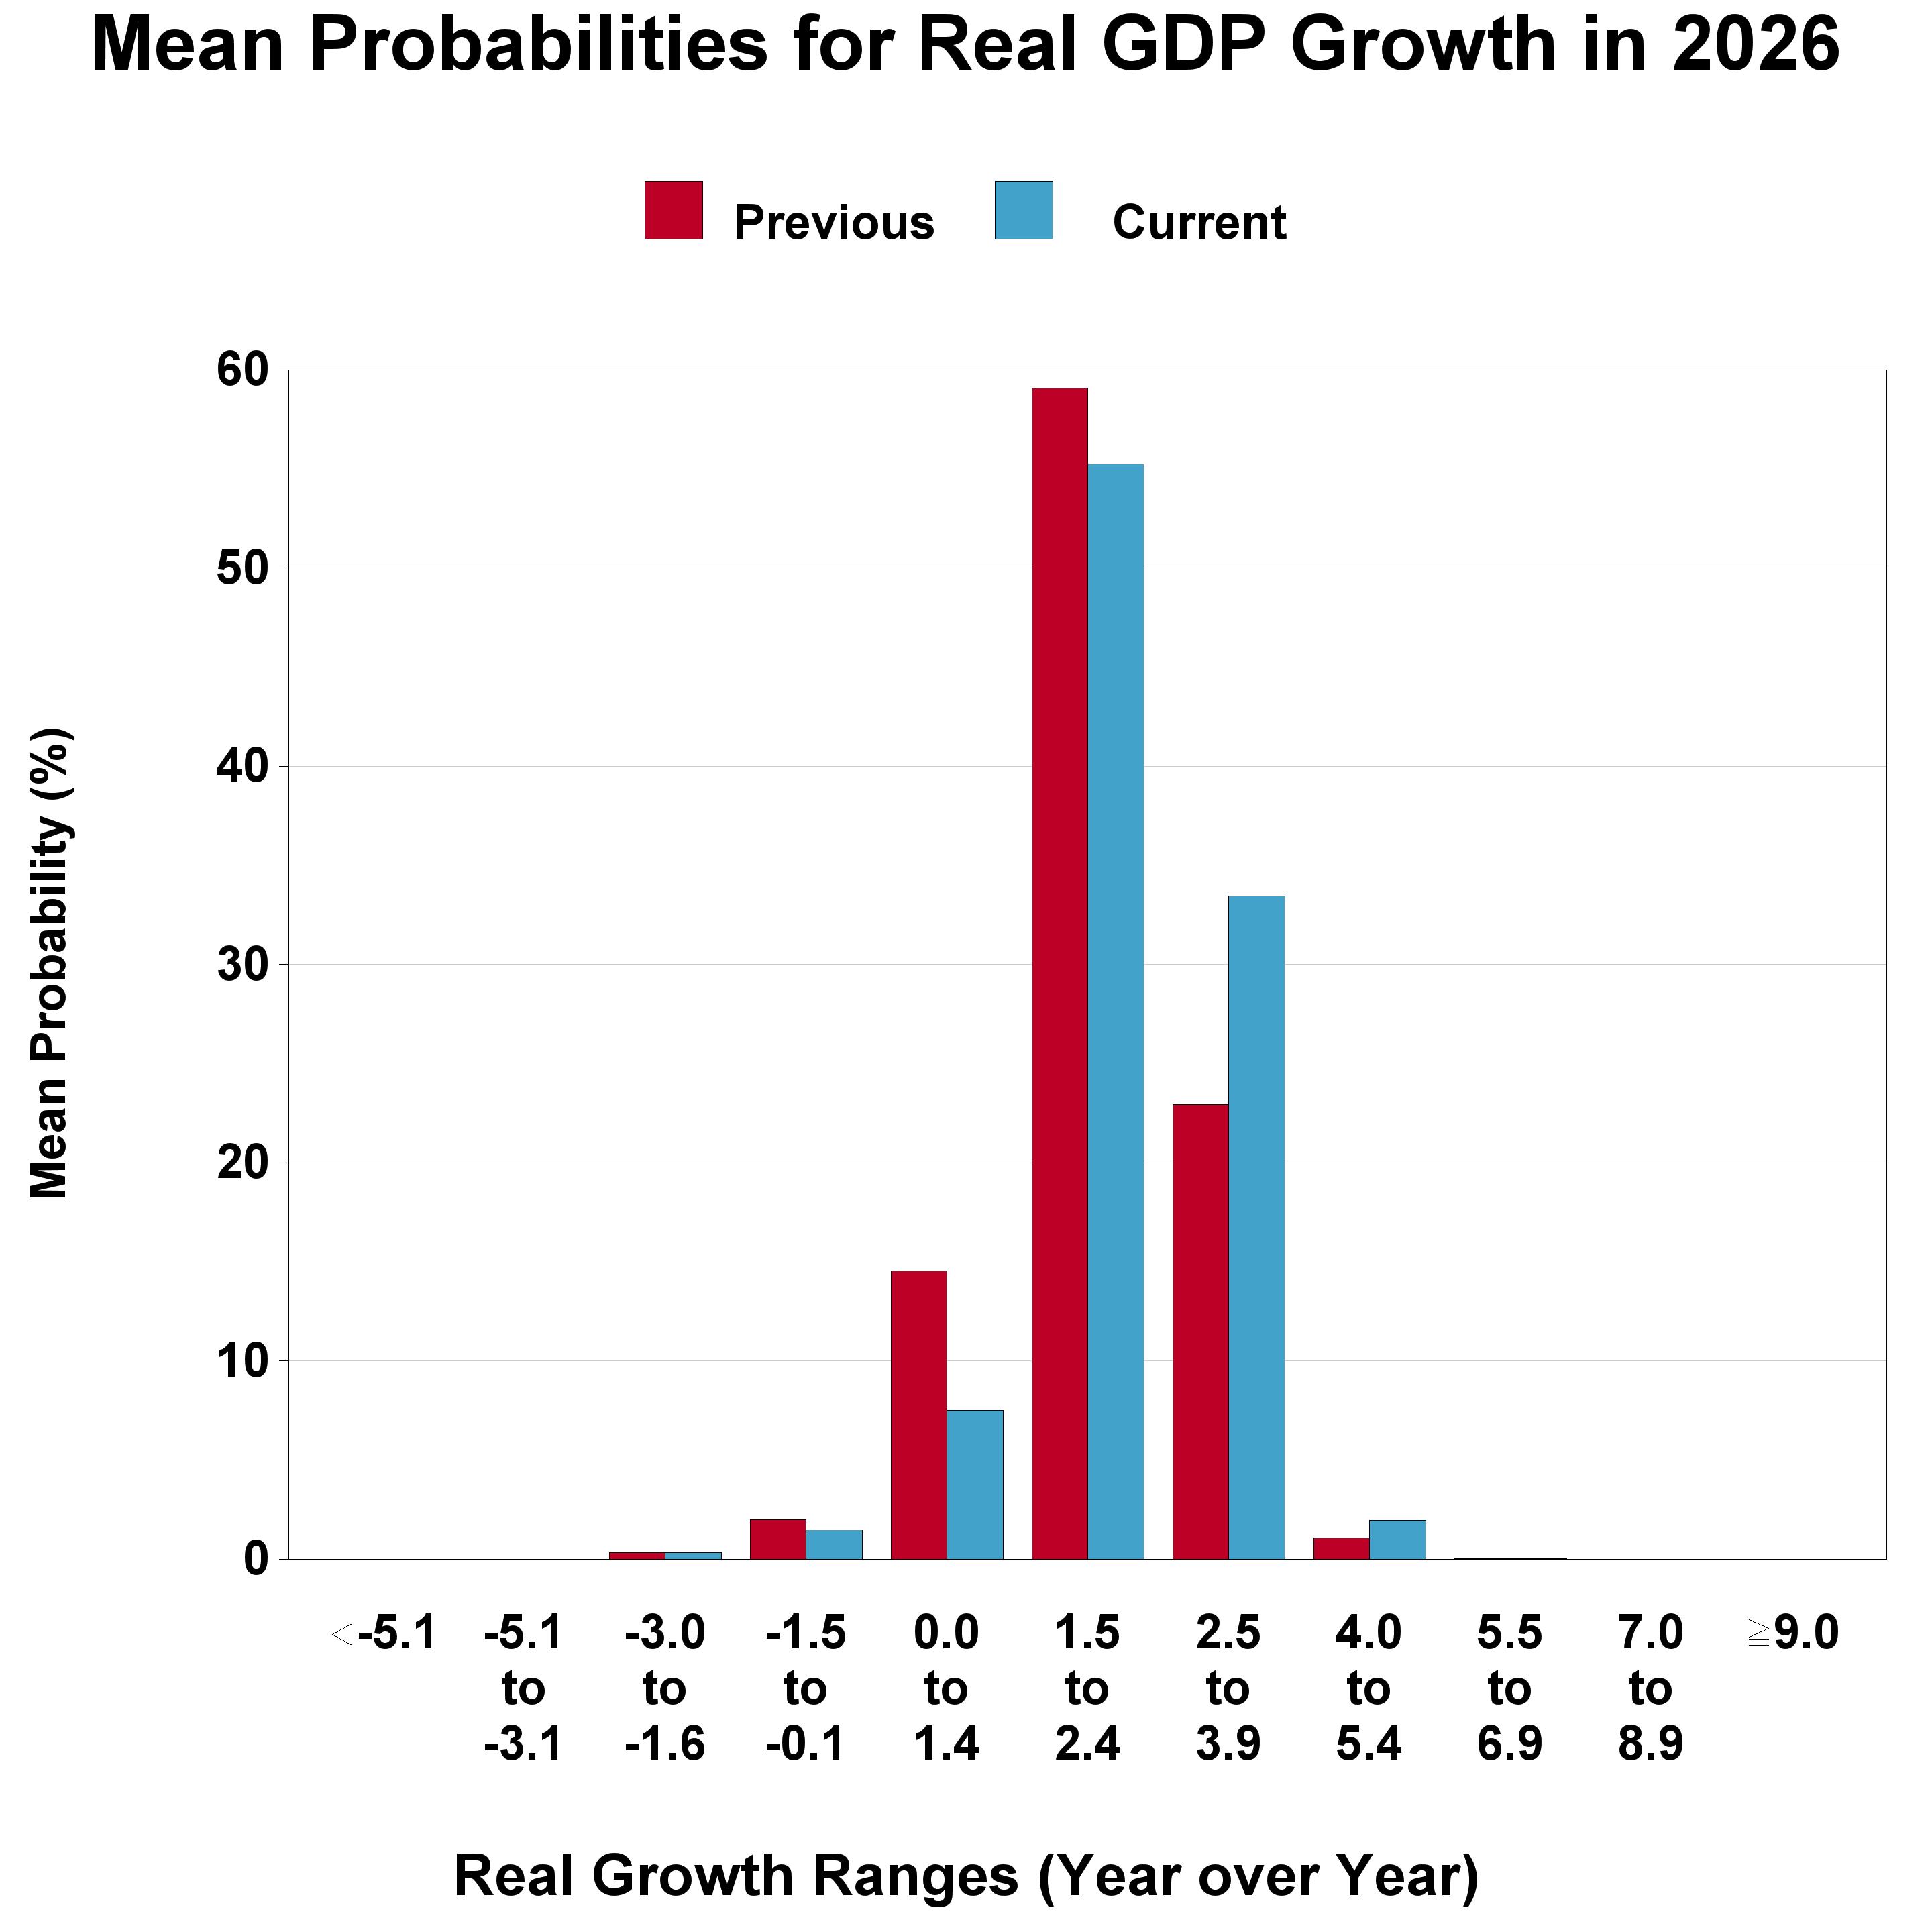
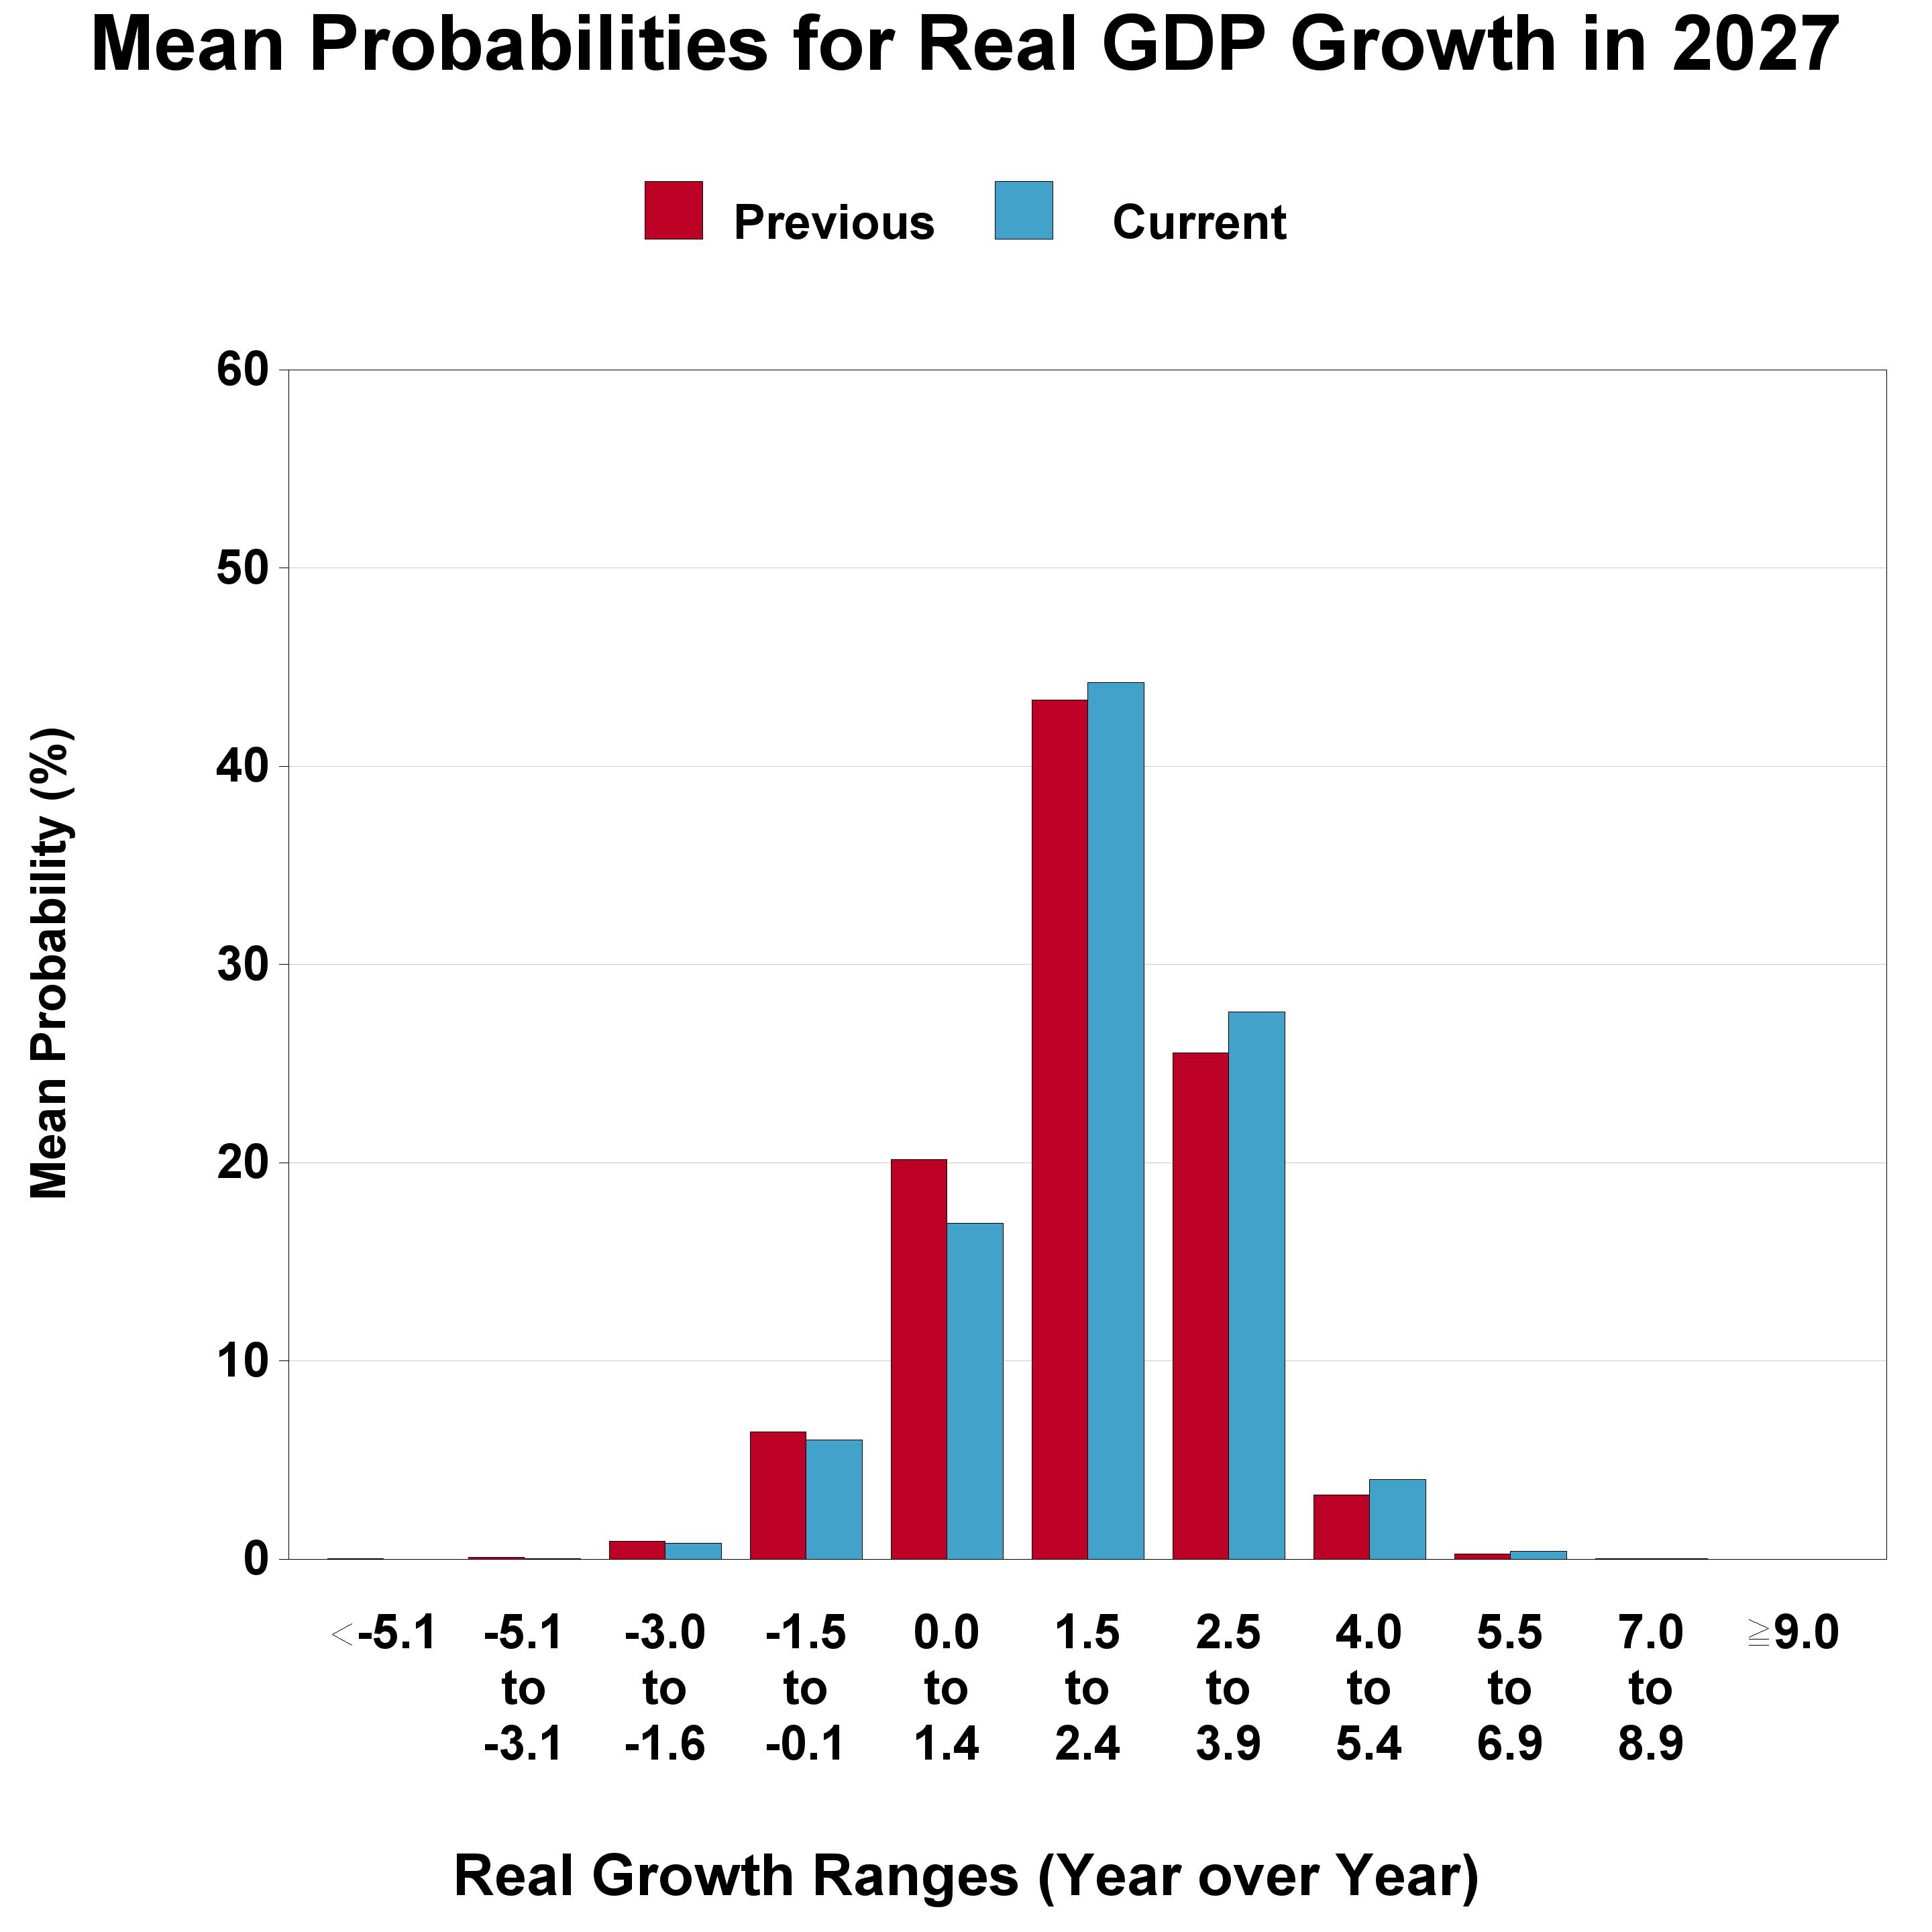
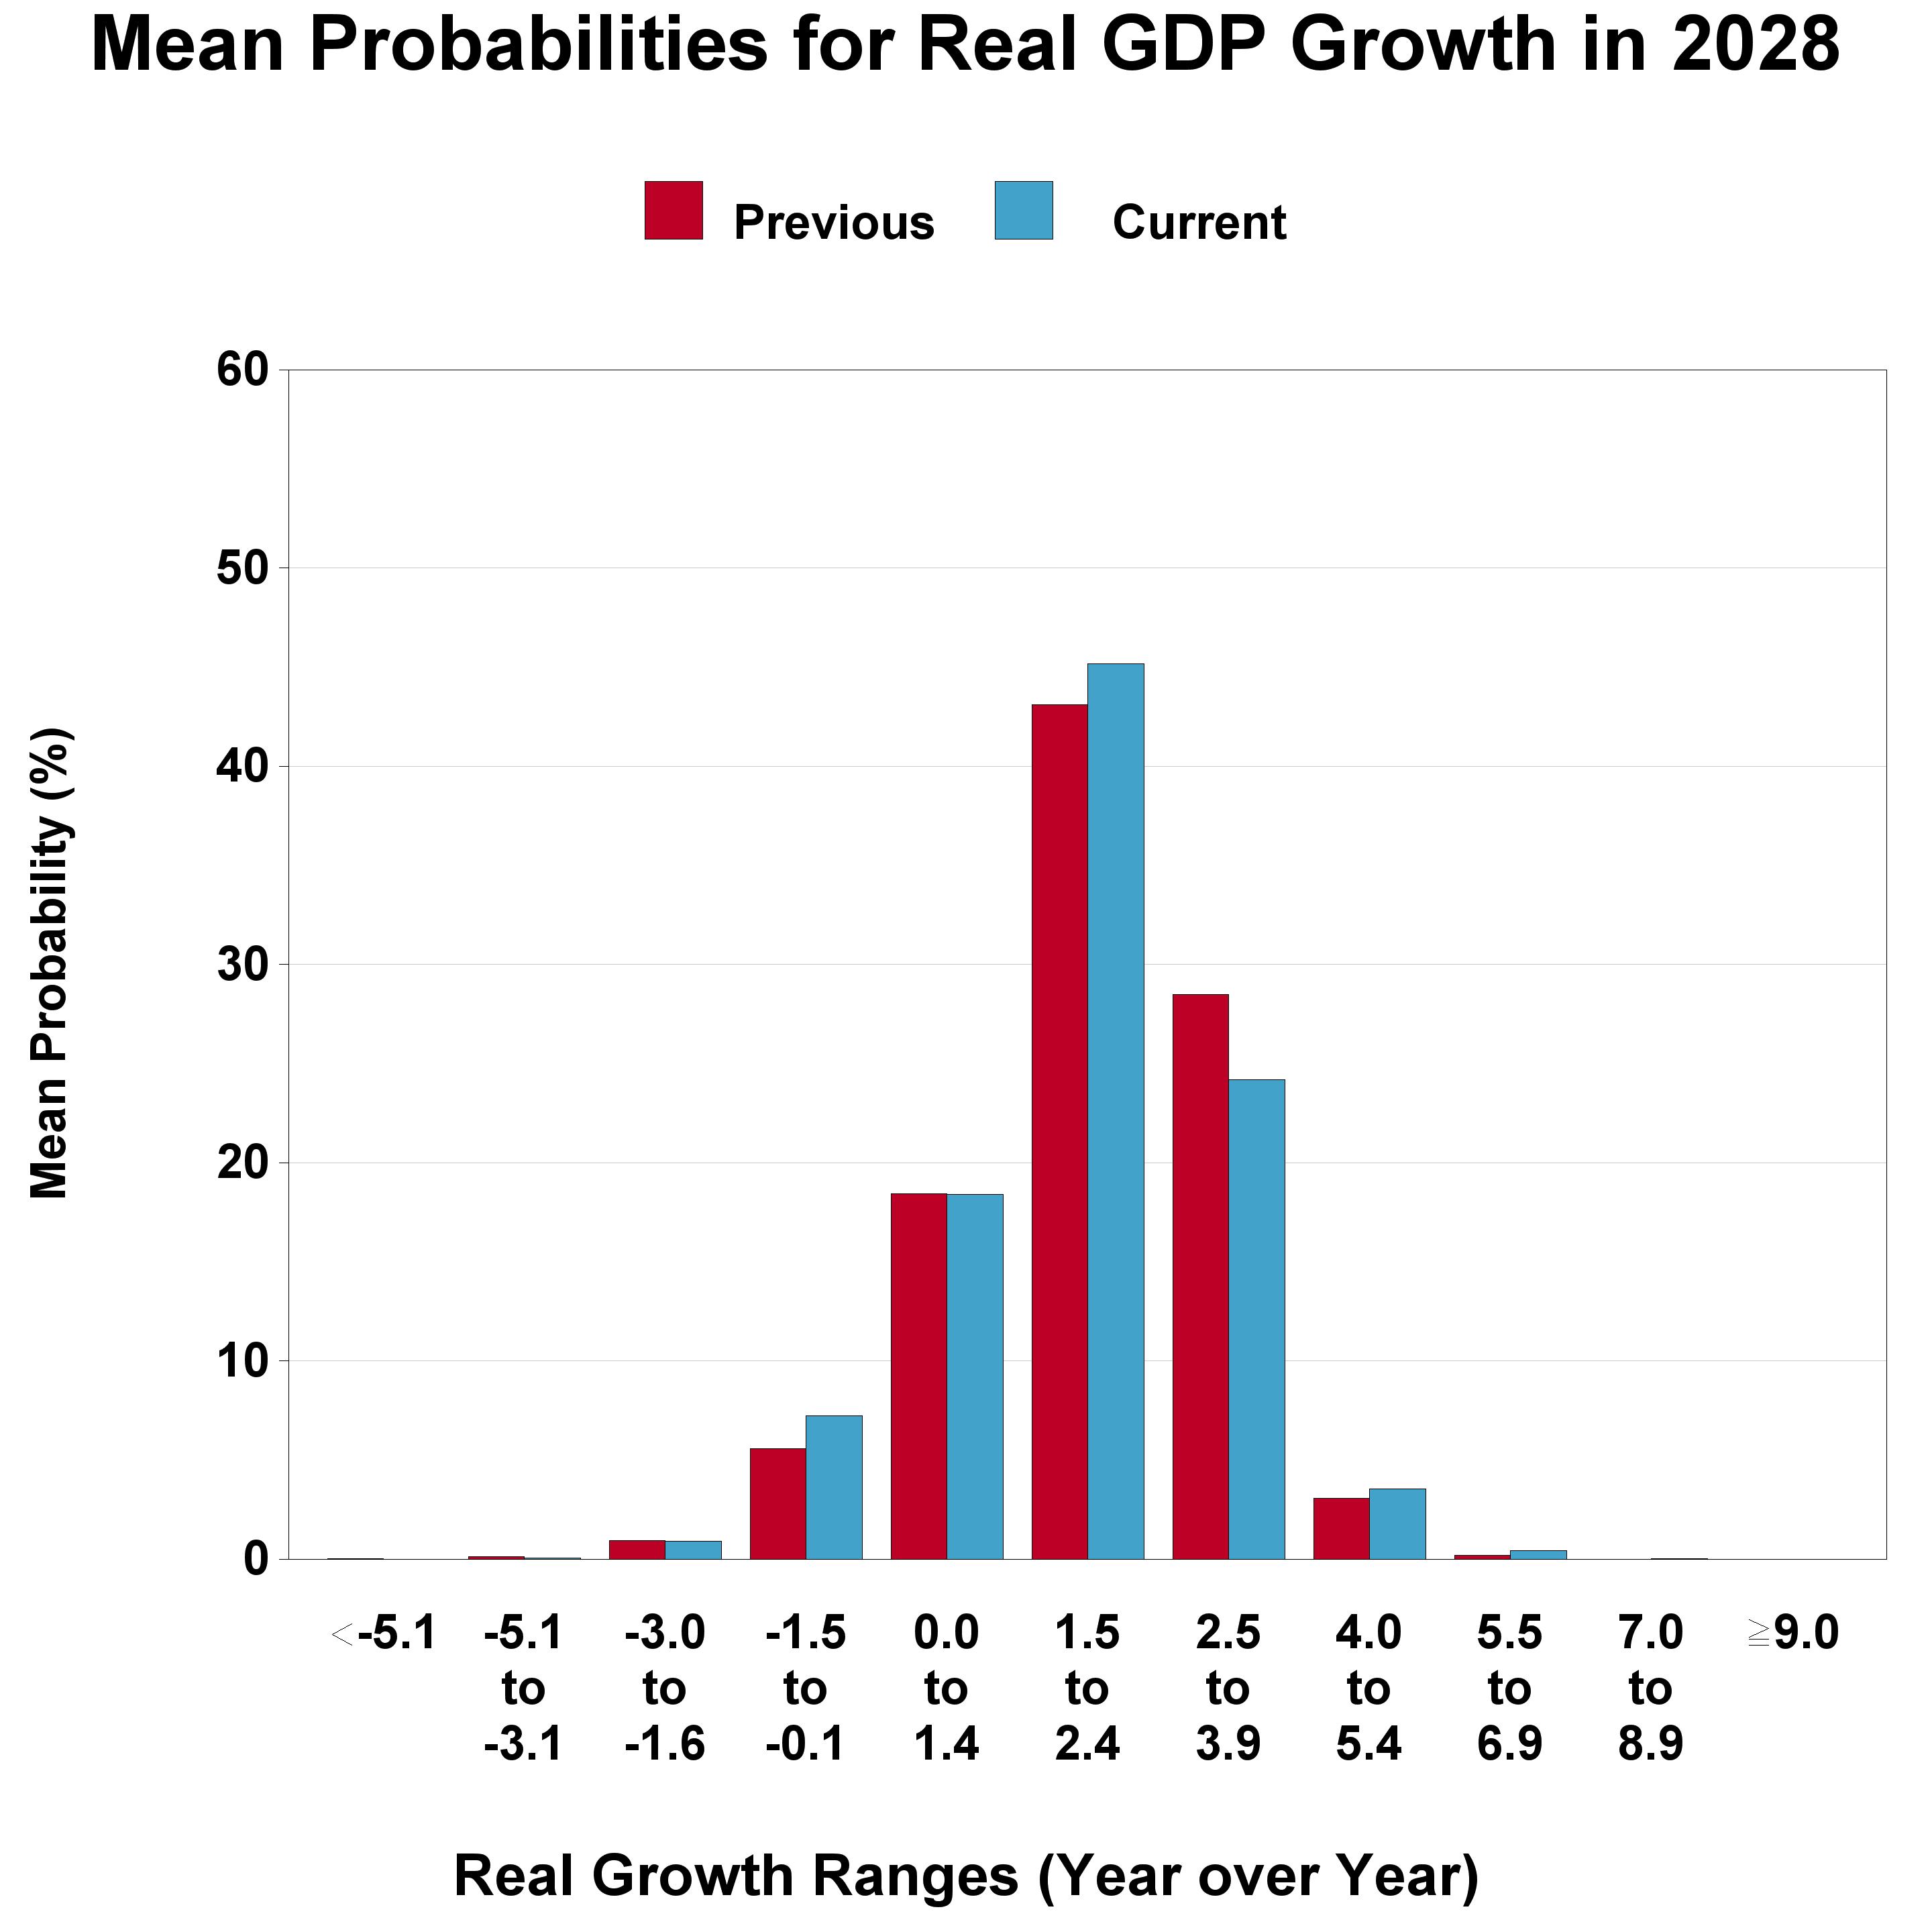
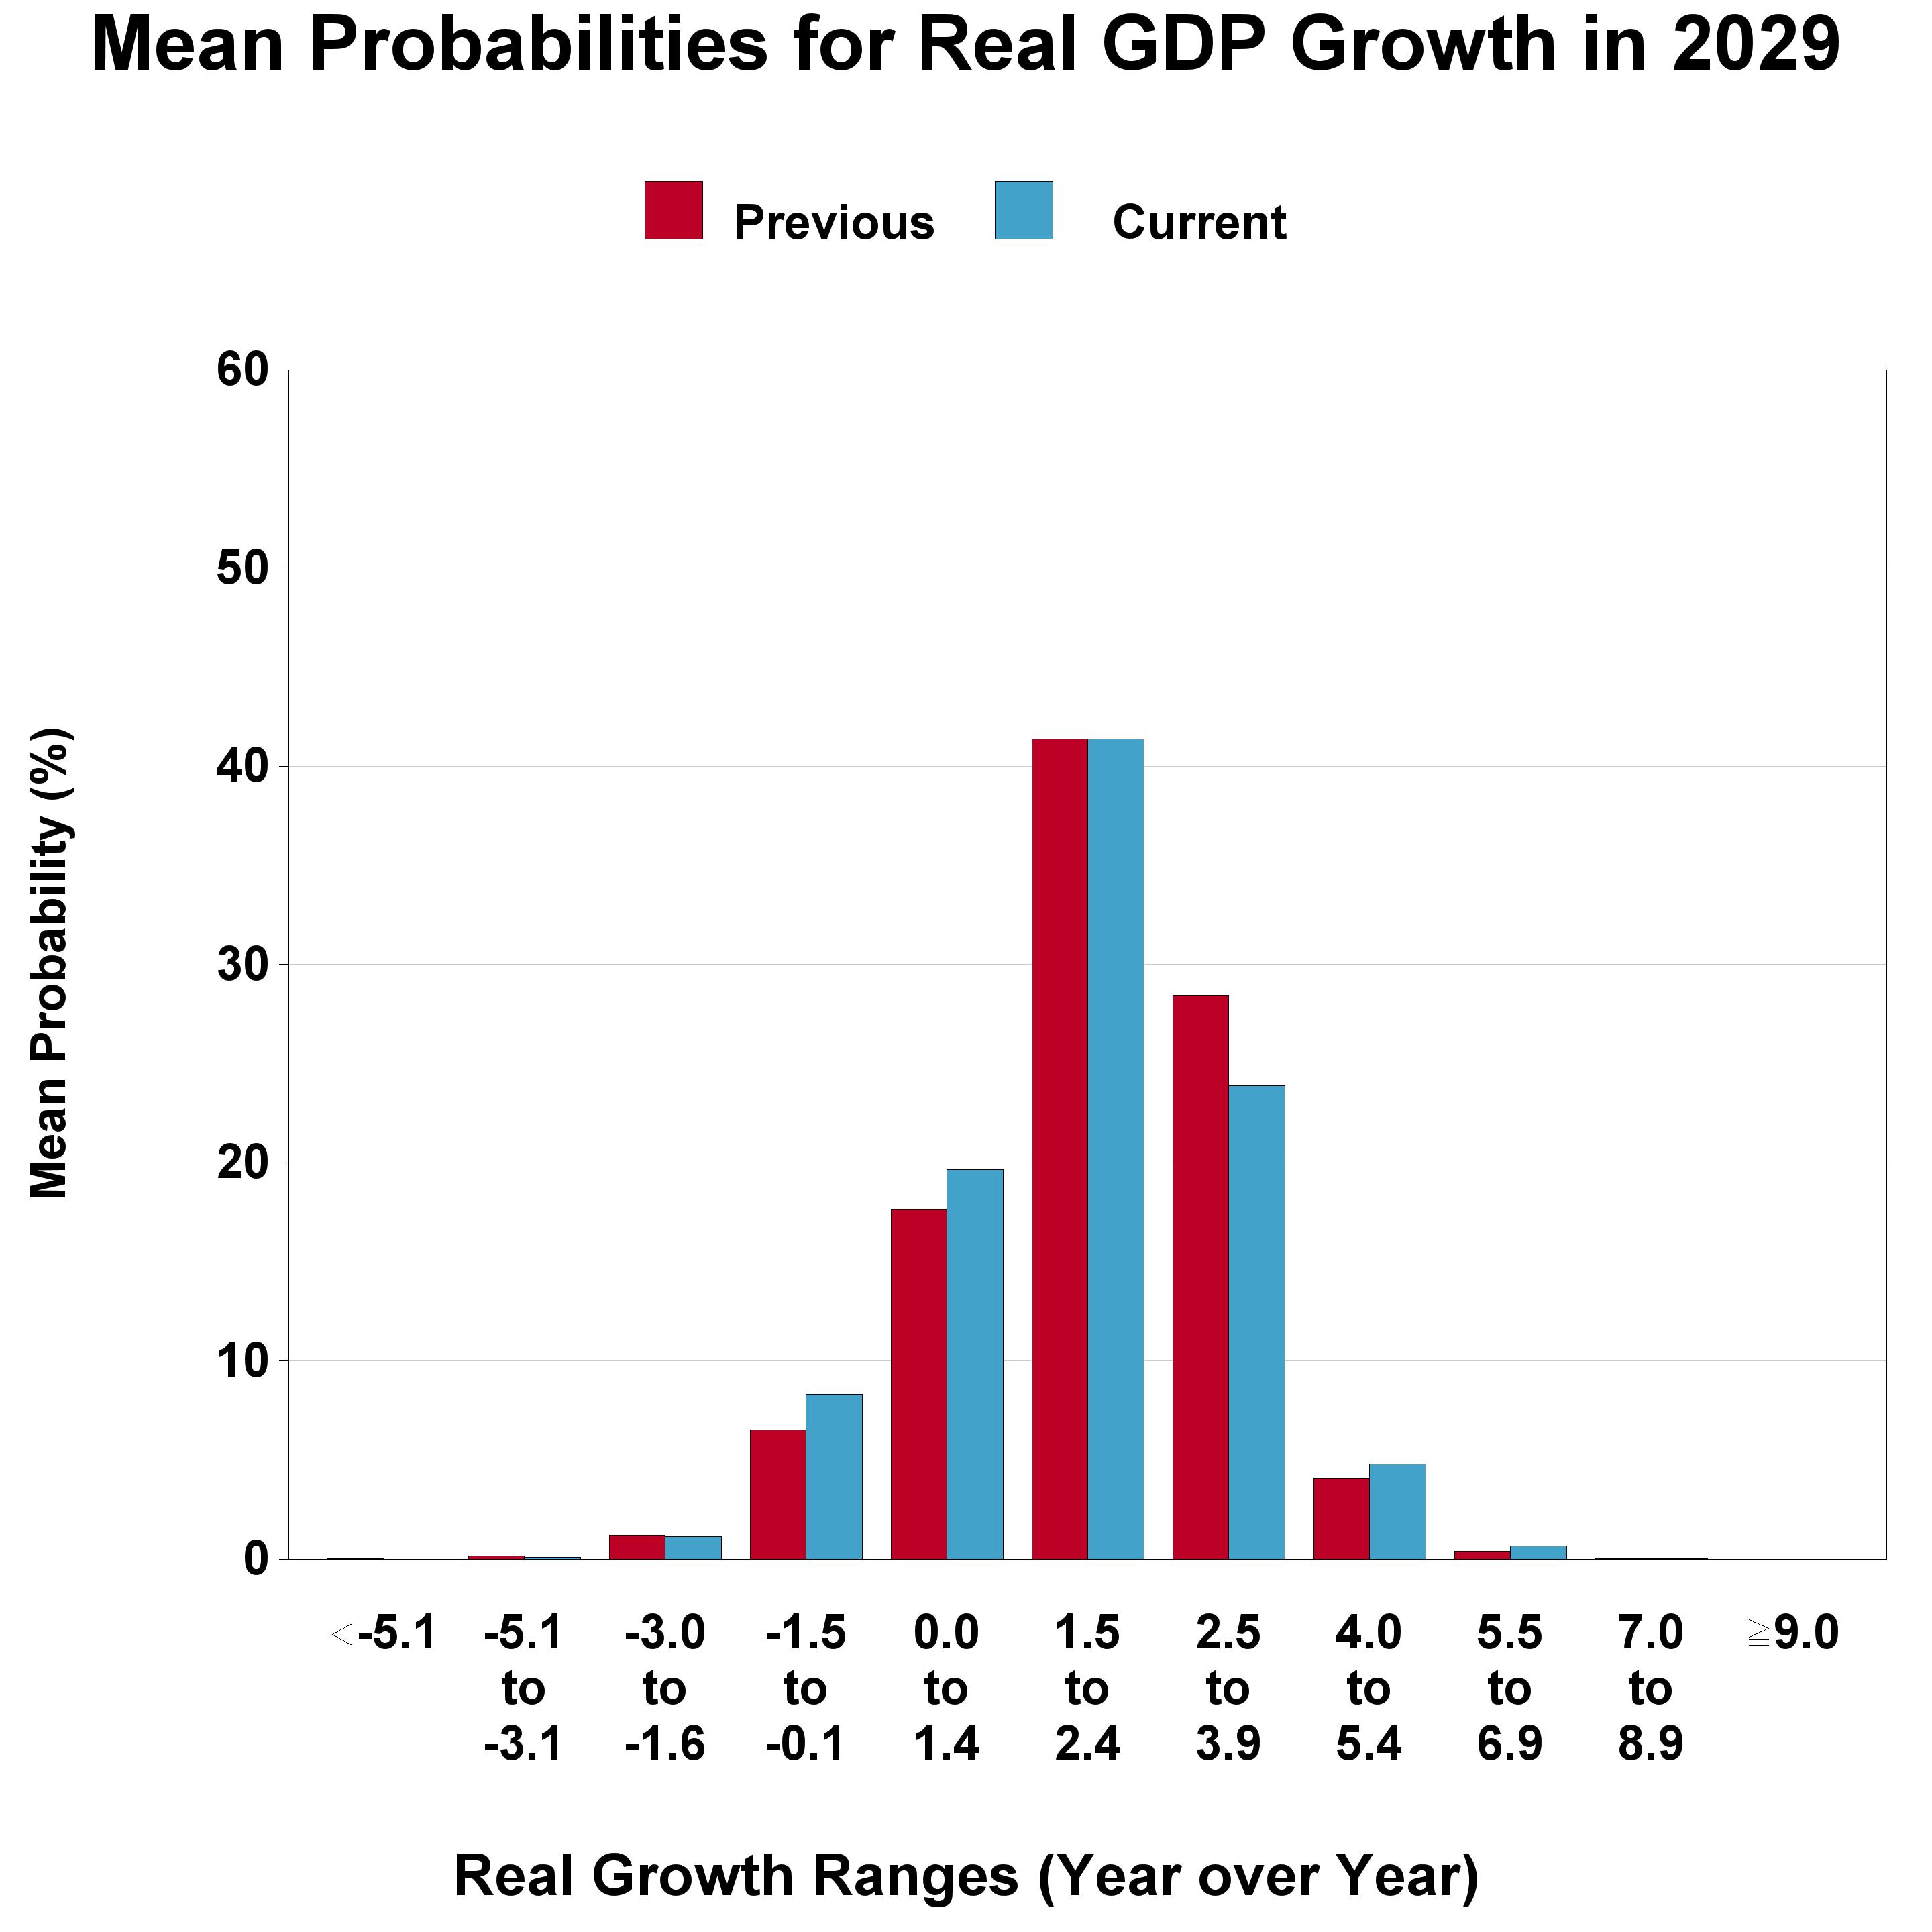
The charts below provide some insight into the degree of uncertainty the forecasters have about their projections for the rate of growth in the annual-average level of real GDP. Each chart presents the forecasters’ previous and current estimates of the probability that growth will fall into each of 11 ranges. The forecasters have raised their estimates of the probability that real GDP growth will be between 2.5 and 3.9 percent in 2026. For the following three years, the current real GDP growth probability projections are little changed compared with the previous estimates.
- Mean Probabilities for Real GDP Growth in 2026 (chart)
- Mean Probabilities for Real GDP Growth in 2027 (chart)
- Mean Probabilities for Real GDP Growth in 2028 (chart)
- Mean Probabilities for Real GDP Growth in 2029 (chart)
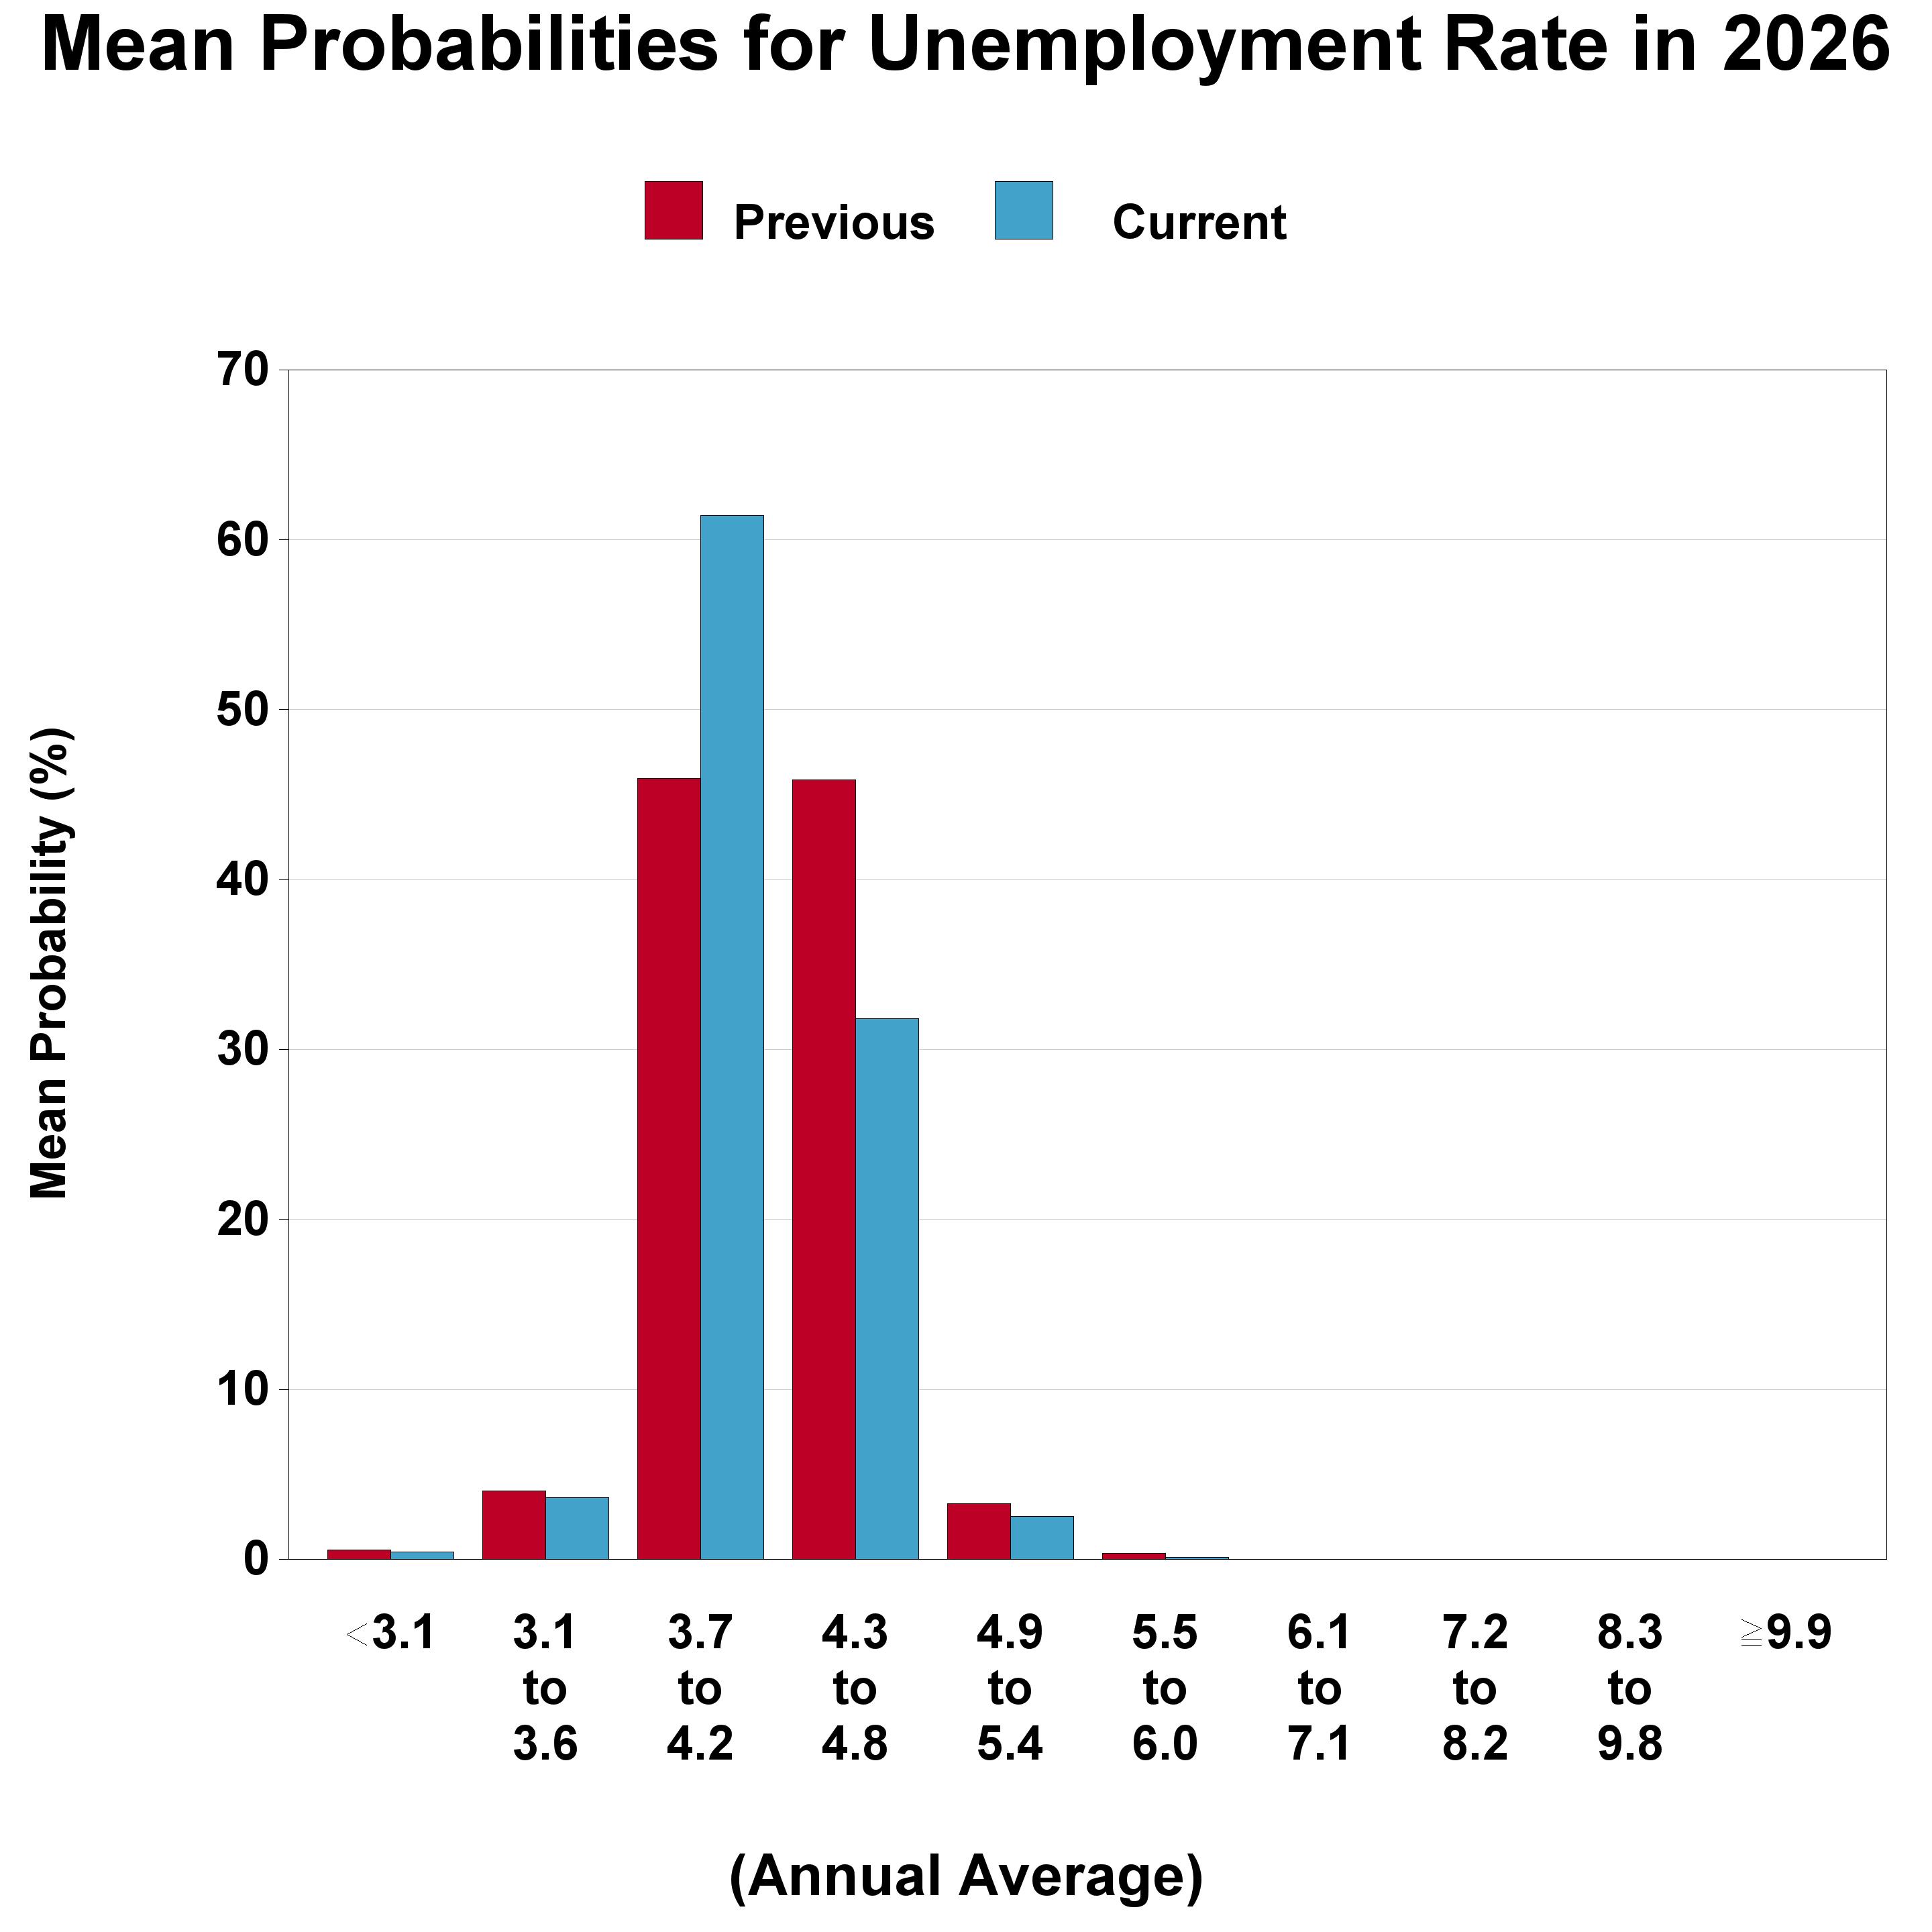
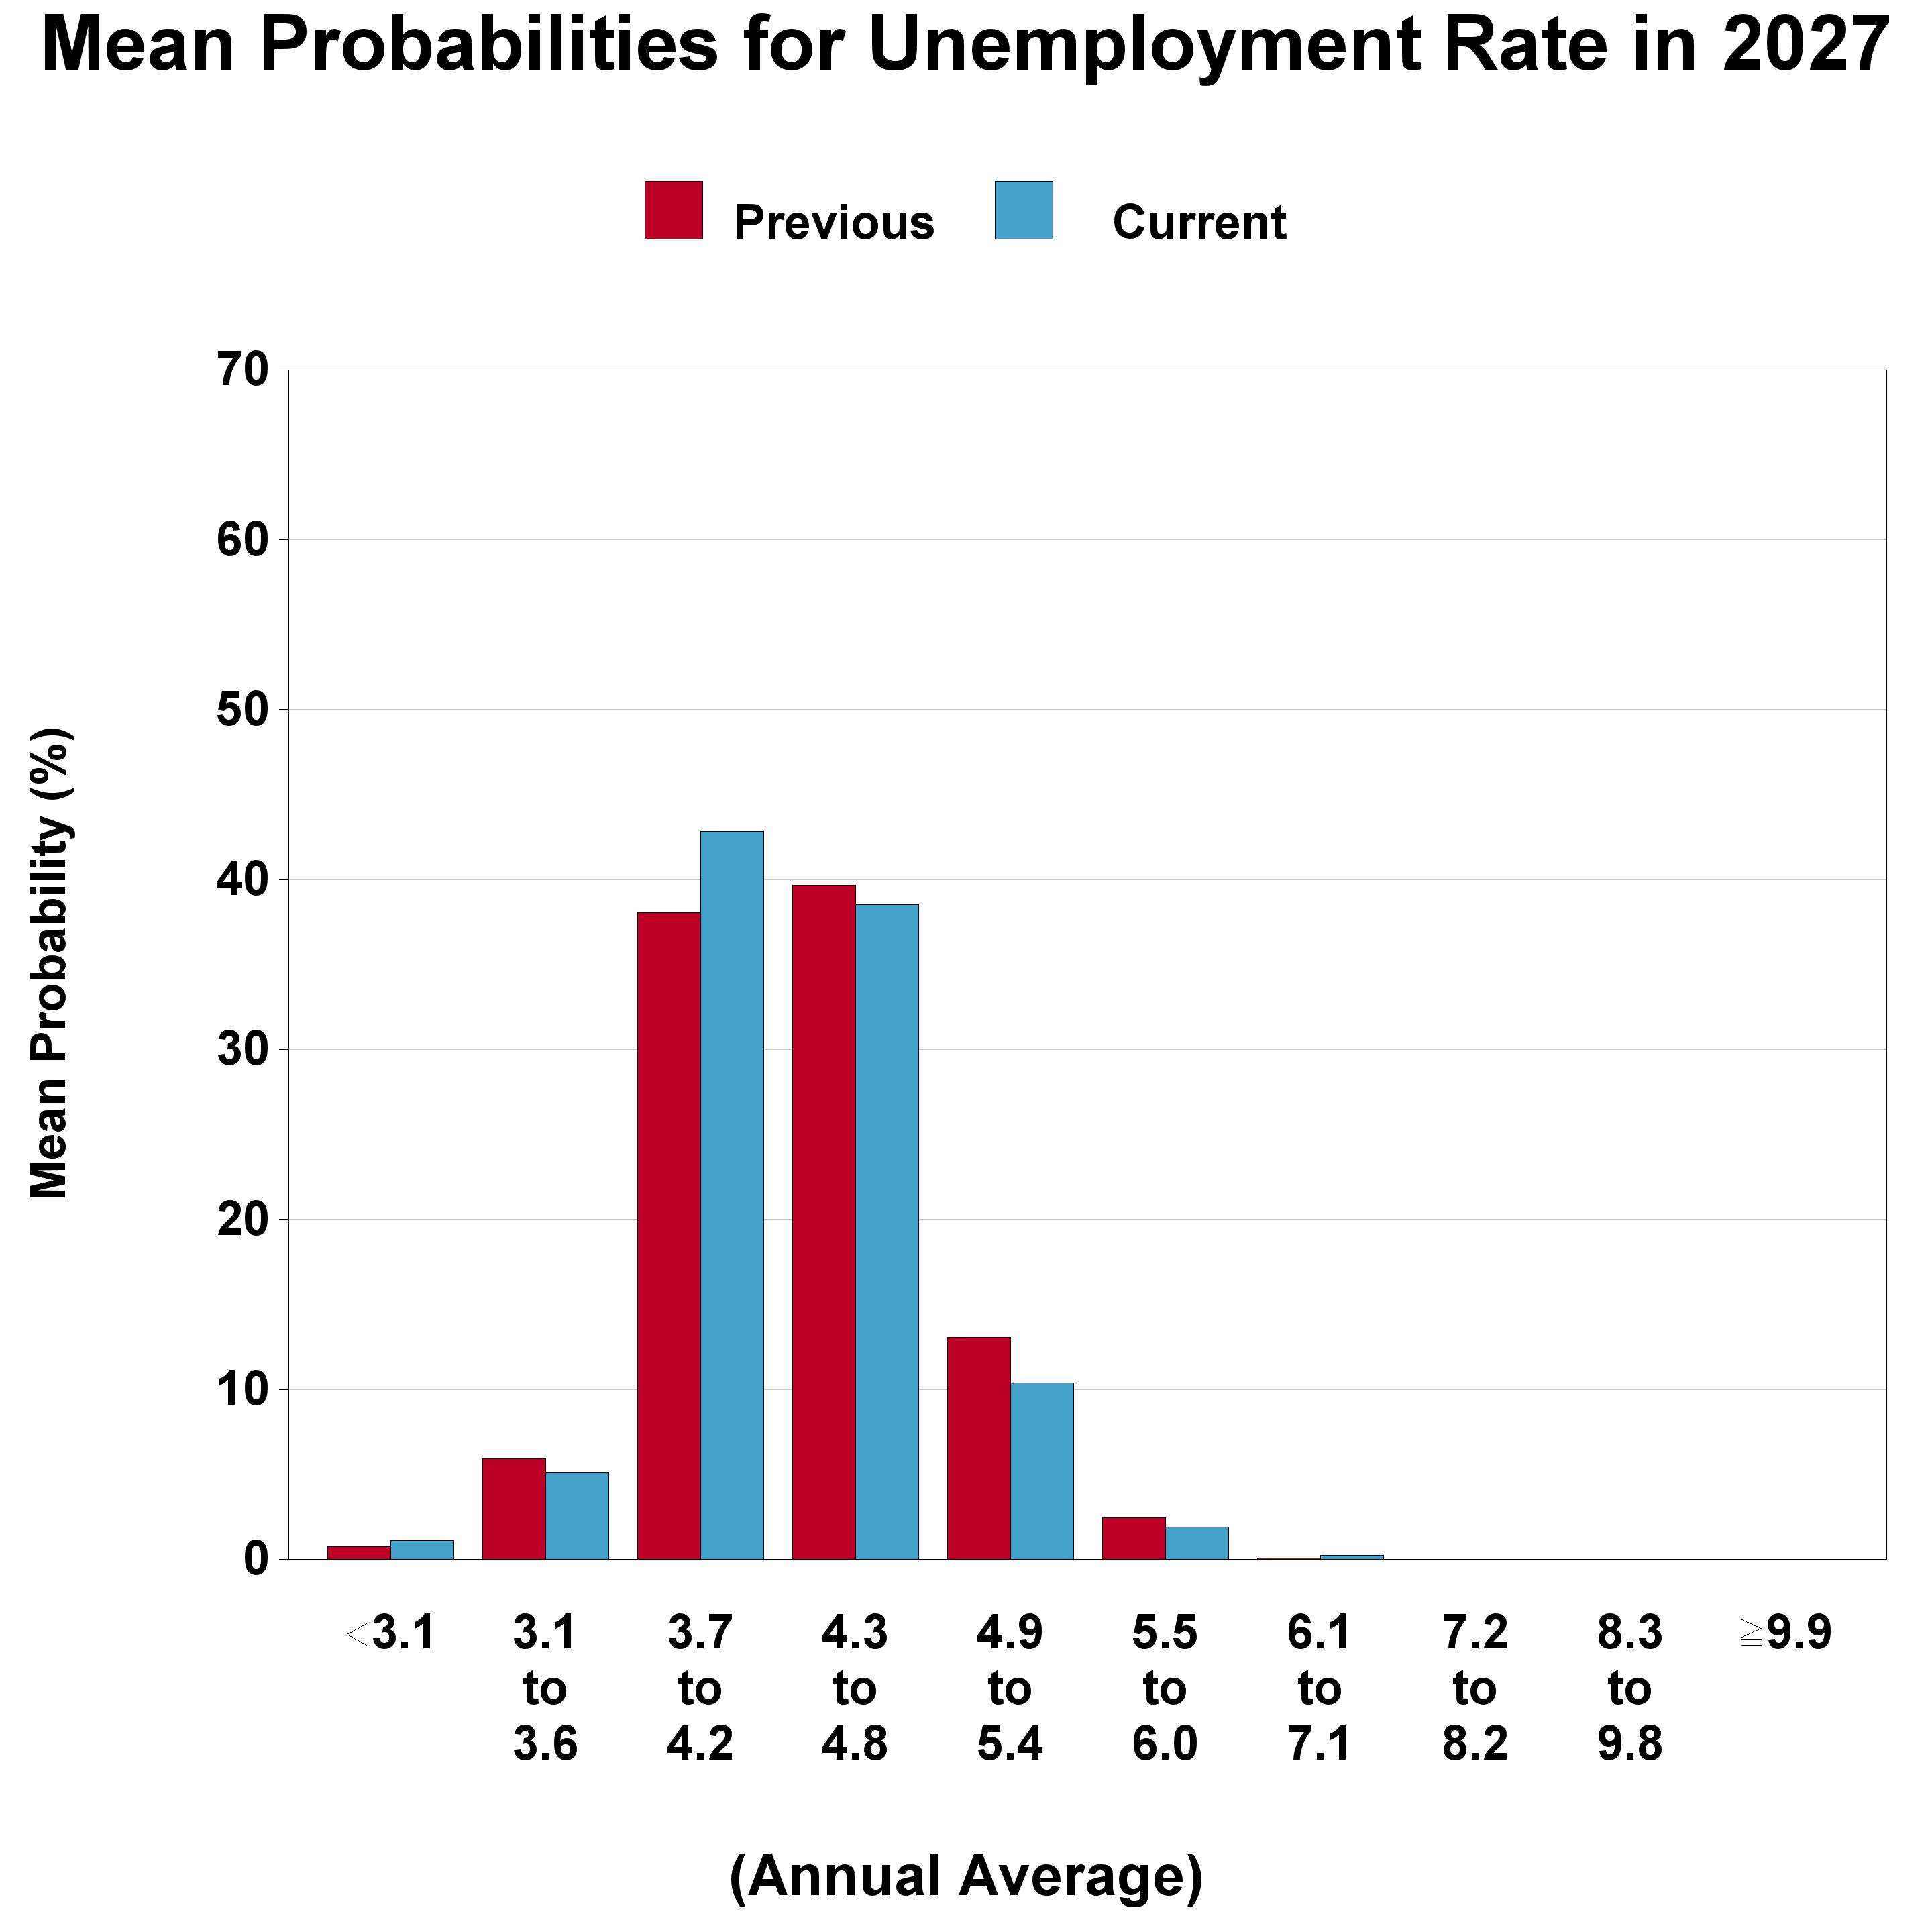
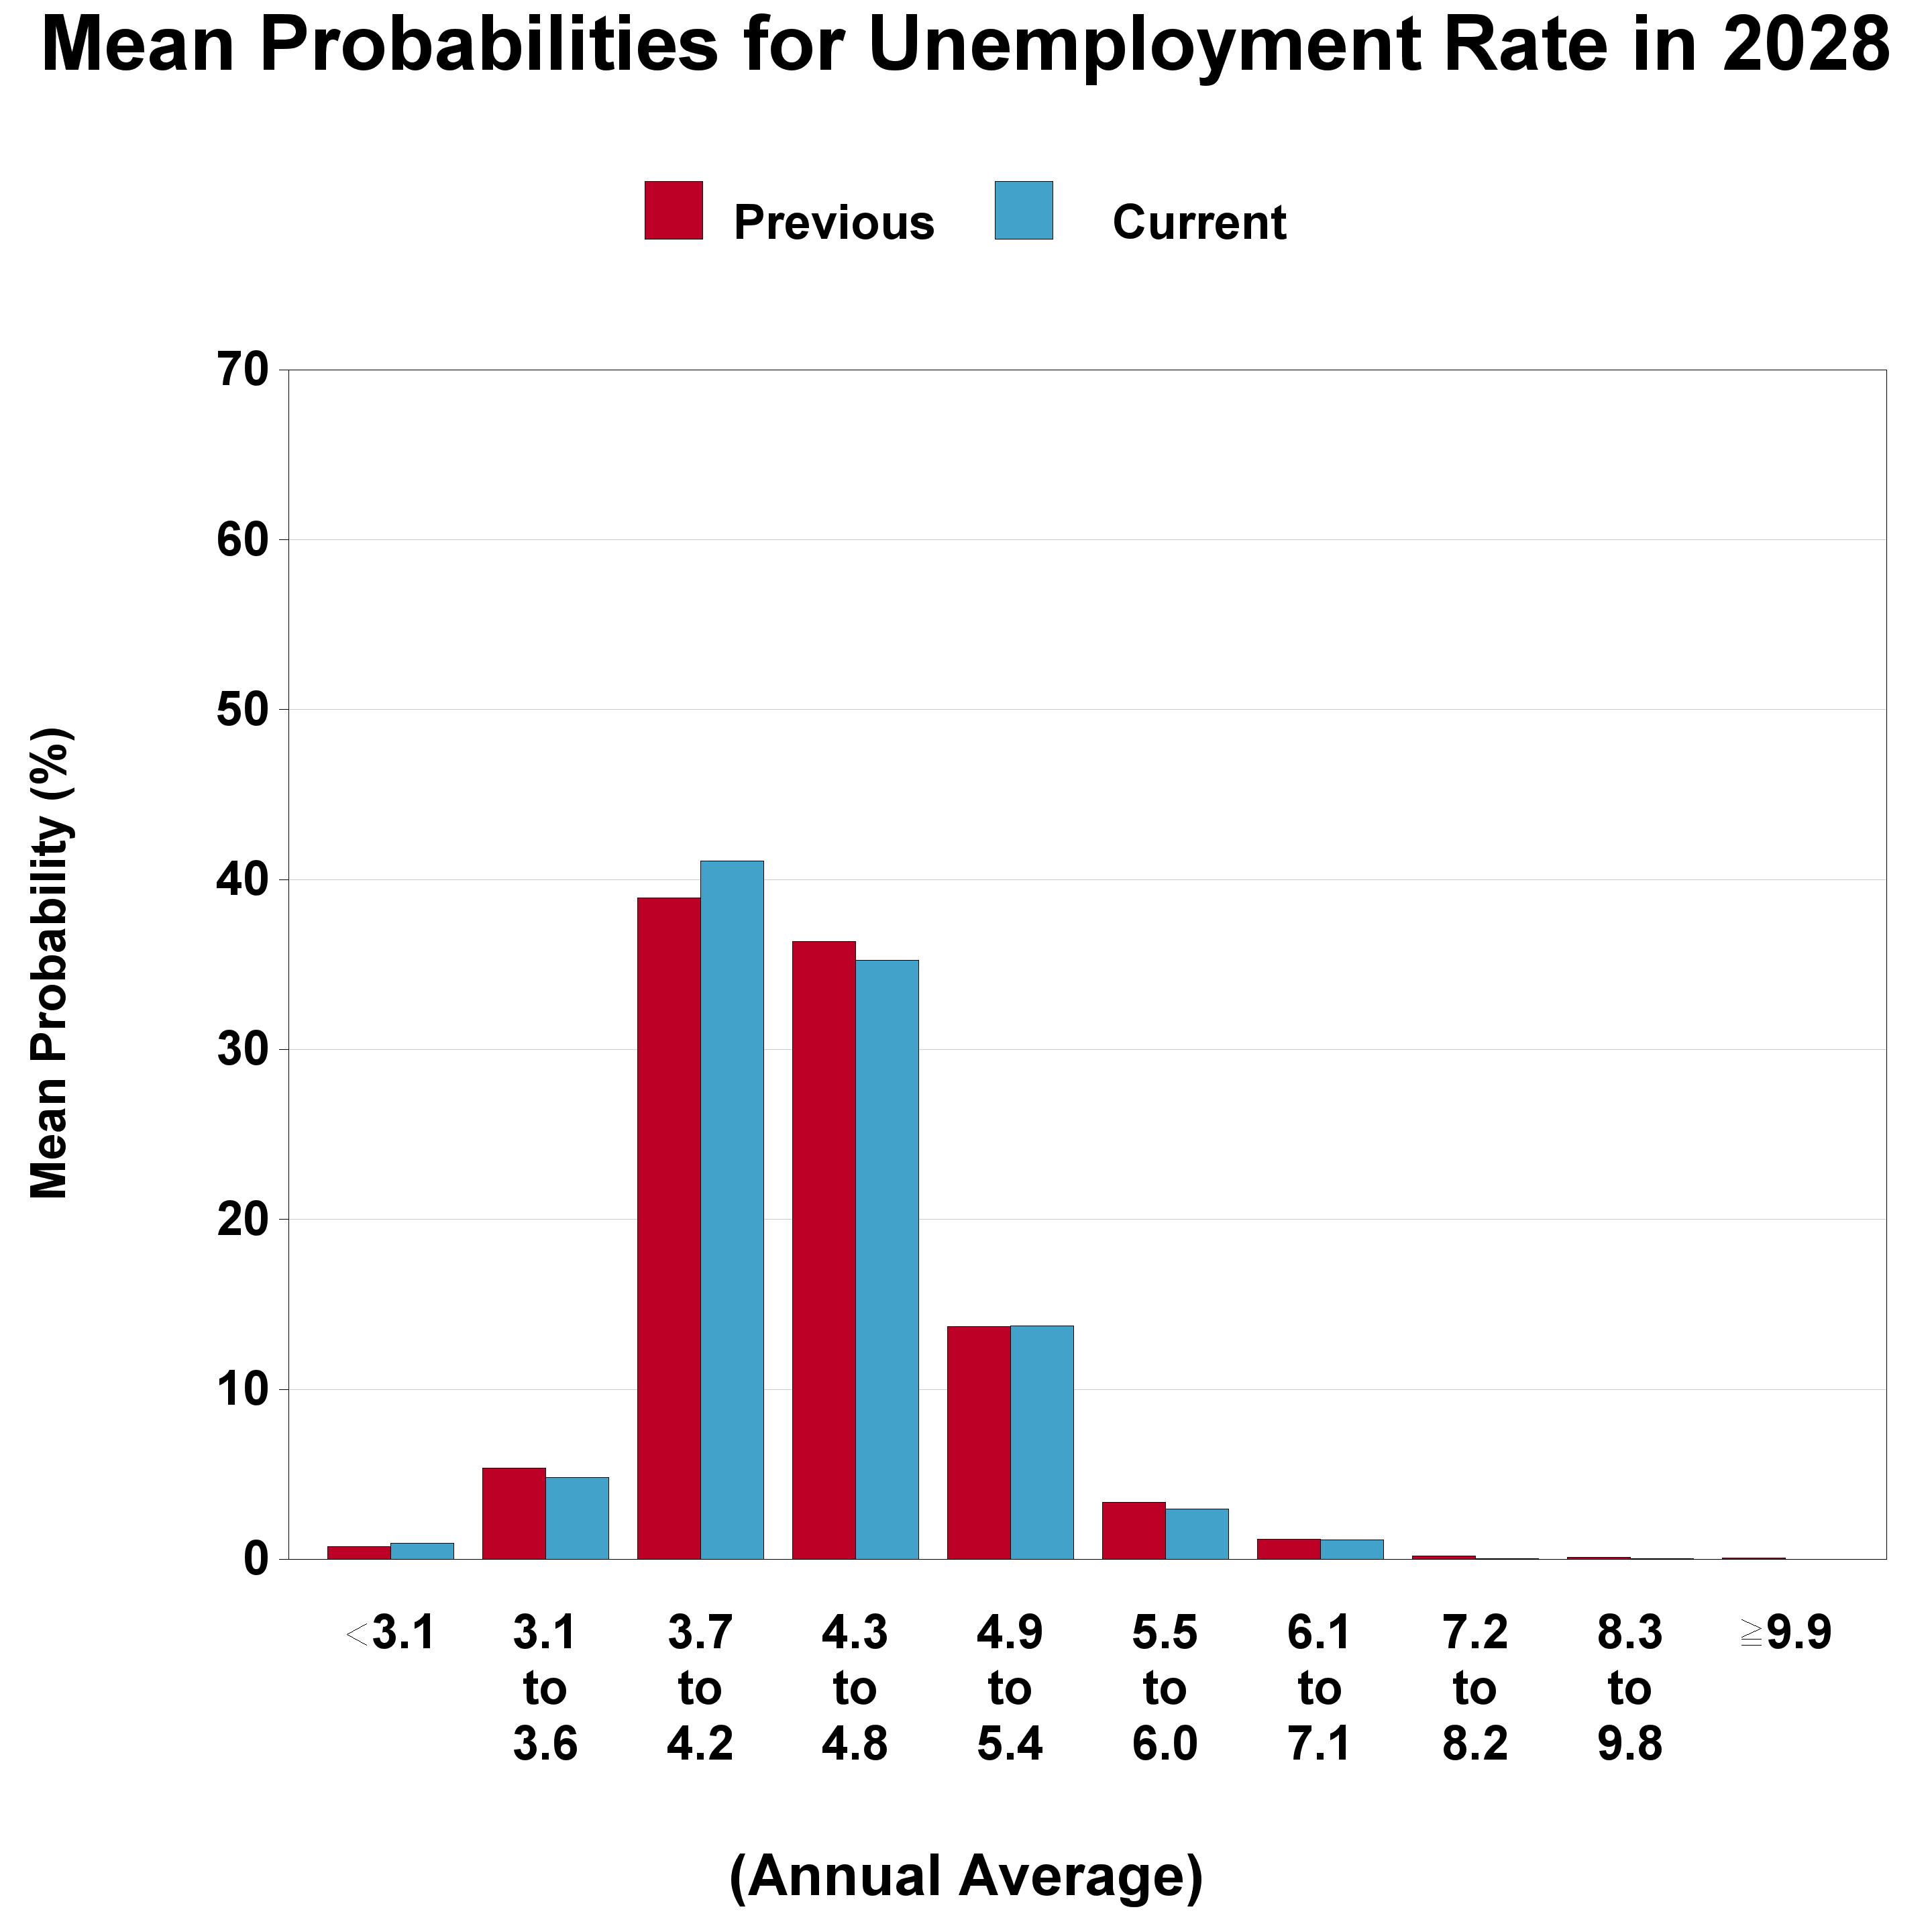
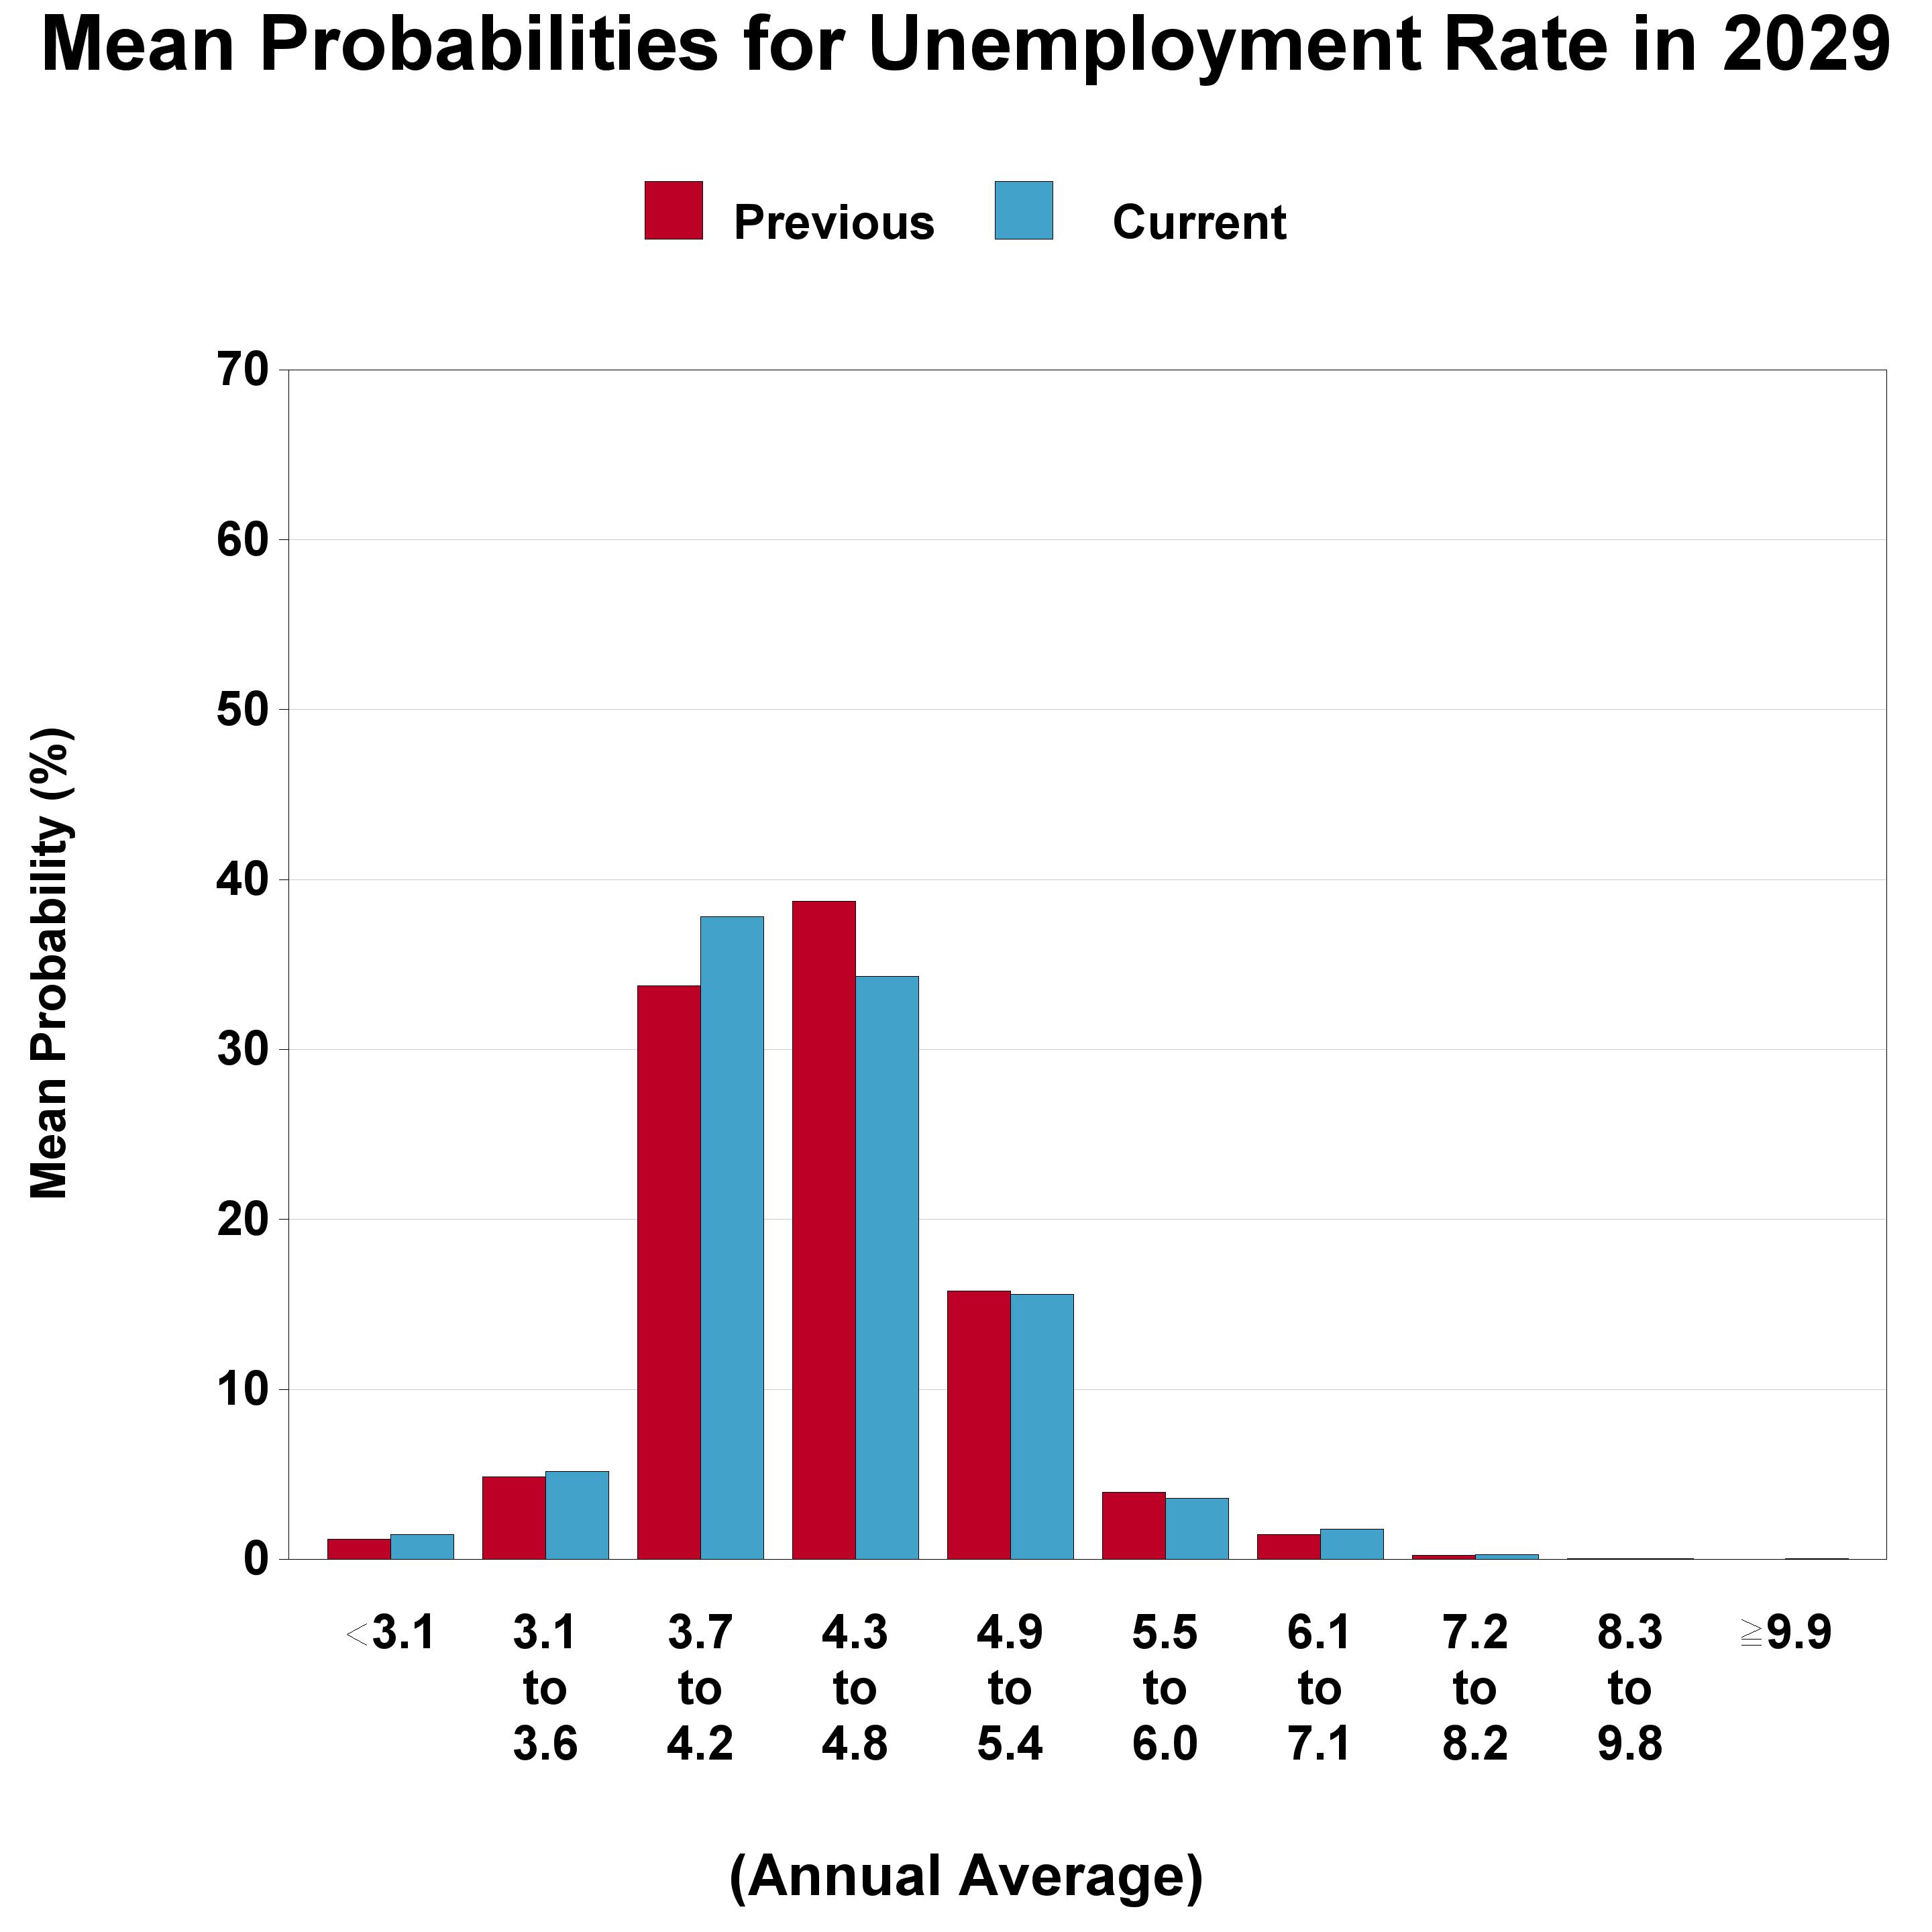
The forecasters’ density projections for unemployment, shown below, shed light on uncertainty about the labor market over the next four years. Each chart presents the forecasters’ current and previous estimates of the probability that unemployment will fall into each of 10 ranges. The forecasters have raised their estimates of the probability that the unemployment rate will be between 3.7 and 4.2 percent in 2026. For the following three years, the current unemployment rate probability projections are little changed compared with the predictions in the last survey.
- Mean Probabilities for Unemployment Rate in 2026 (chart)
- Mean Probabilities for Unemployment Rate in 2027 (chart)
- Mean Probabilities for Unemployment Rate in 2028 (chart)
- Mean Probabilities for Unemployment Rate in 2029 (chart)
Forecasters Predict Higher Inflation
The forecasters expect current-quarter headline CPI inflation will average 4.0 percent at an annual rate, up from their prediction of 2.5 percent in the previous survey. They also predict higher headline PCE inflation over the current quarter at an annual rate of 3.5 percent, up from the previous estimate of 2.6 percent. The predictions for current-quarter core CPI and core PCE inflation are also higher compared with their predictions in the last survey.
Measured on a fourth-quarter over fourth-quarter basis, headline CPI and headline PCE inflation in 2026 are expected to average 3.8 percent and 3.7 percent, both higher than the previous estimates. In 2027 and 2028, predictions for these inflation measures are mostly slightly higher compared with the previous survey.
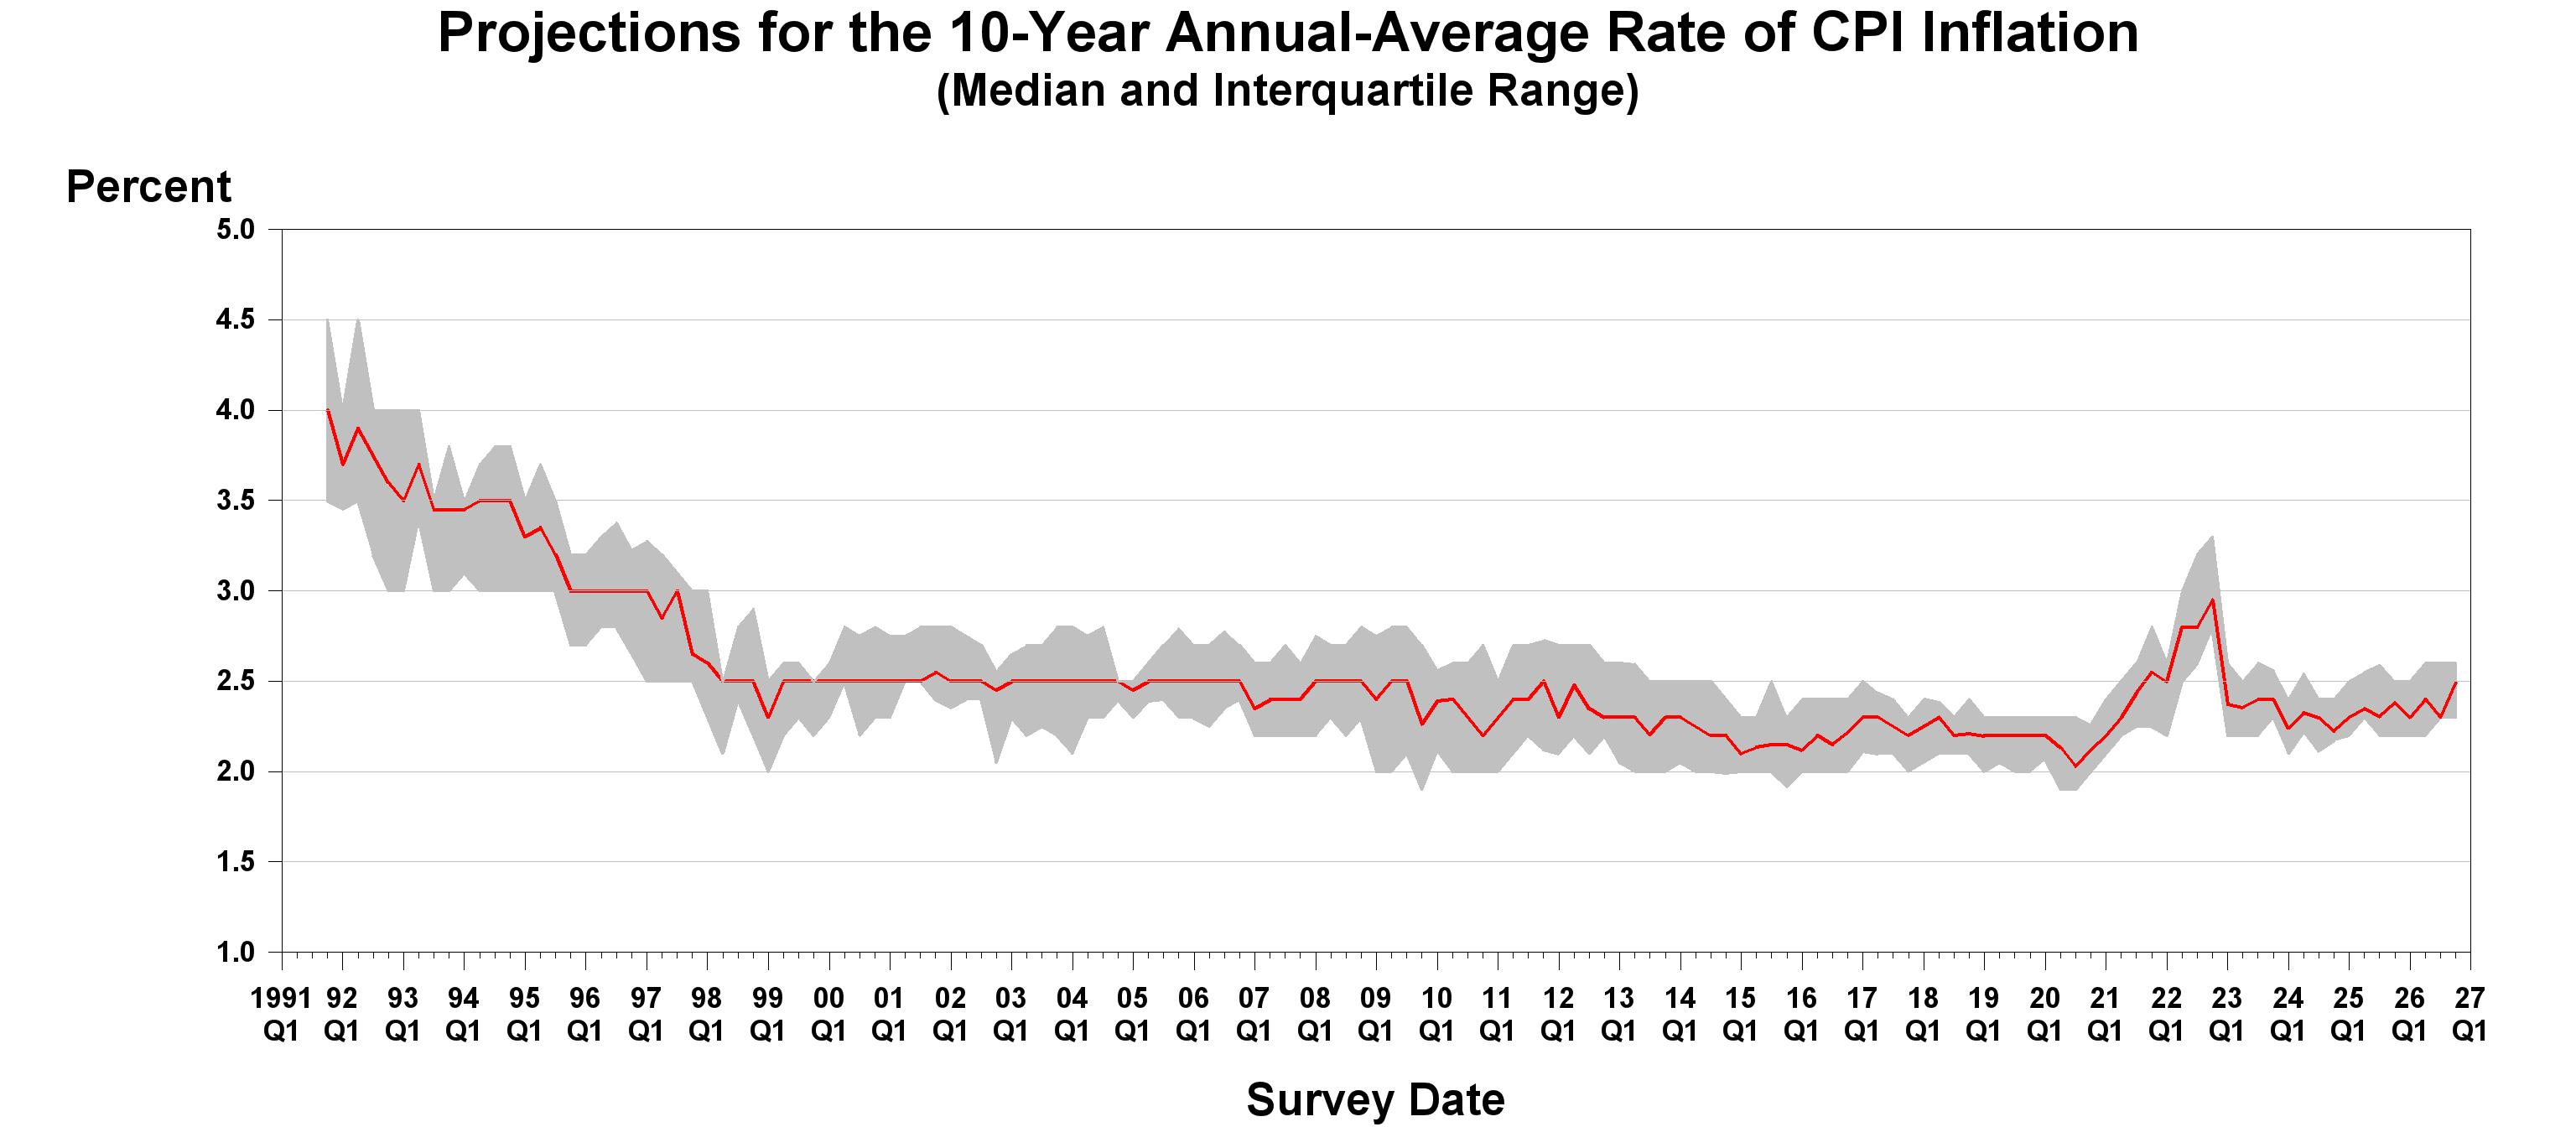
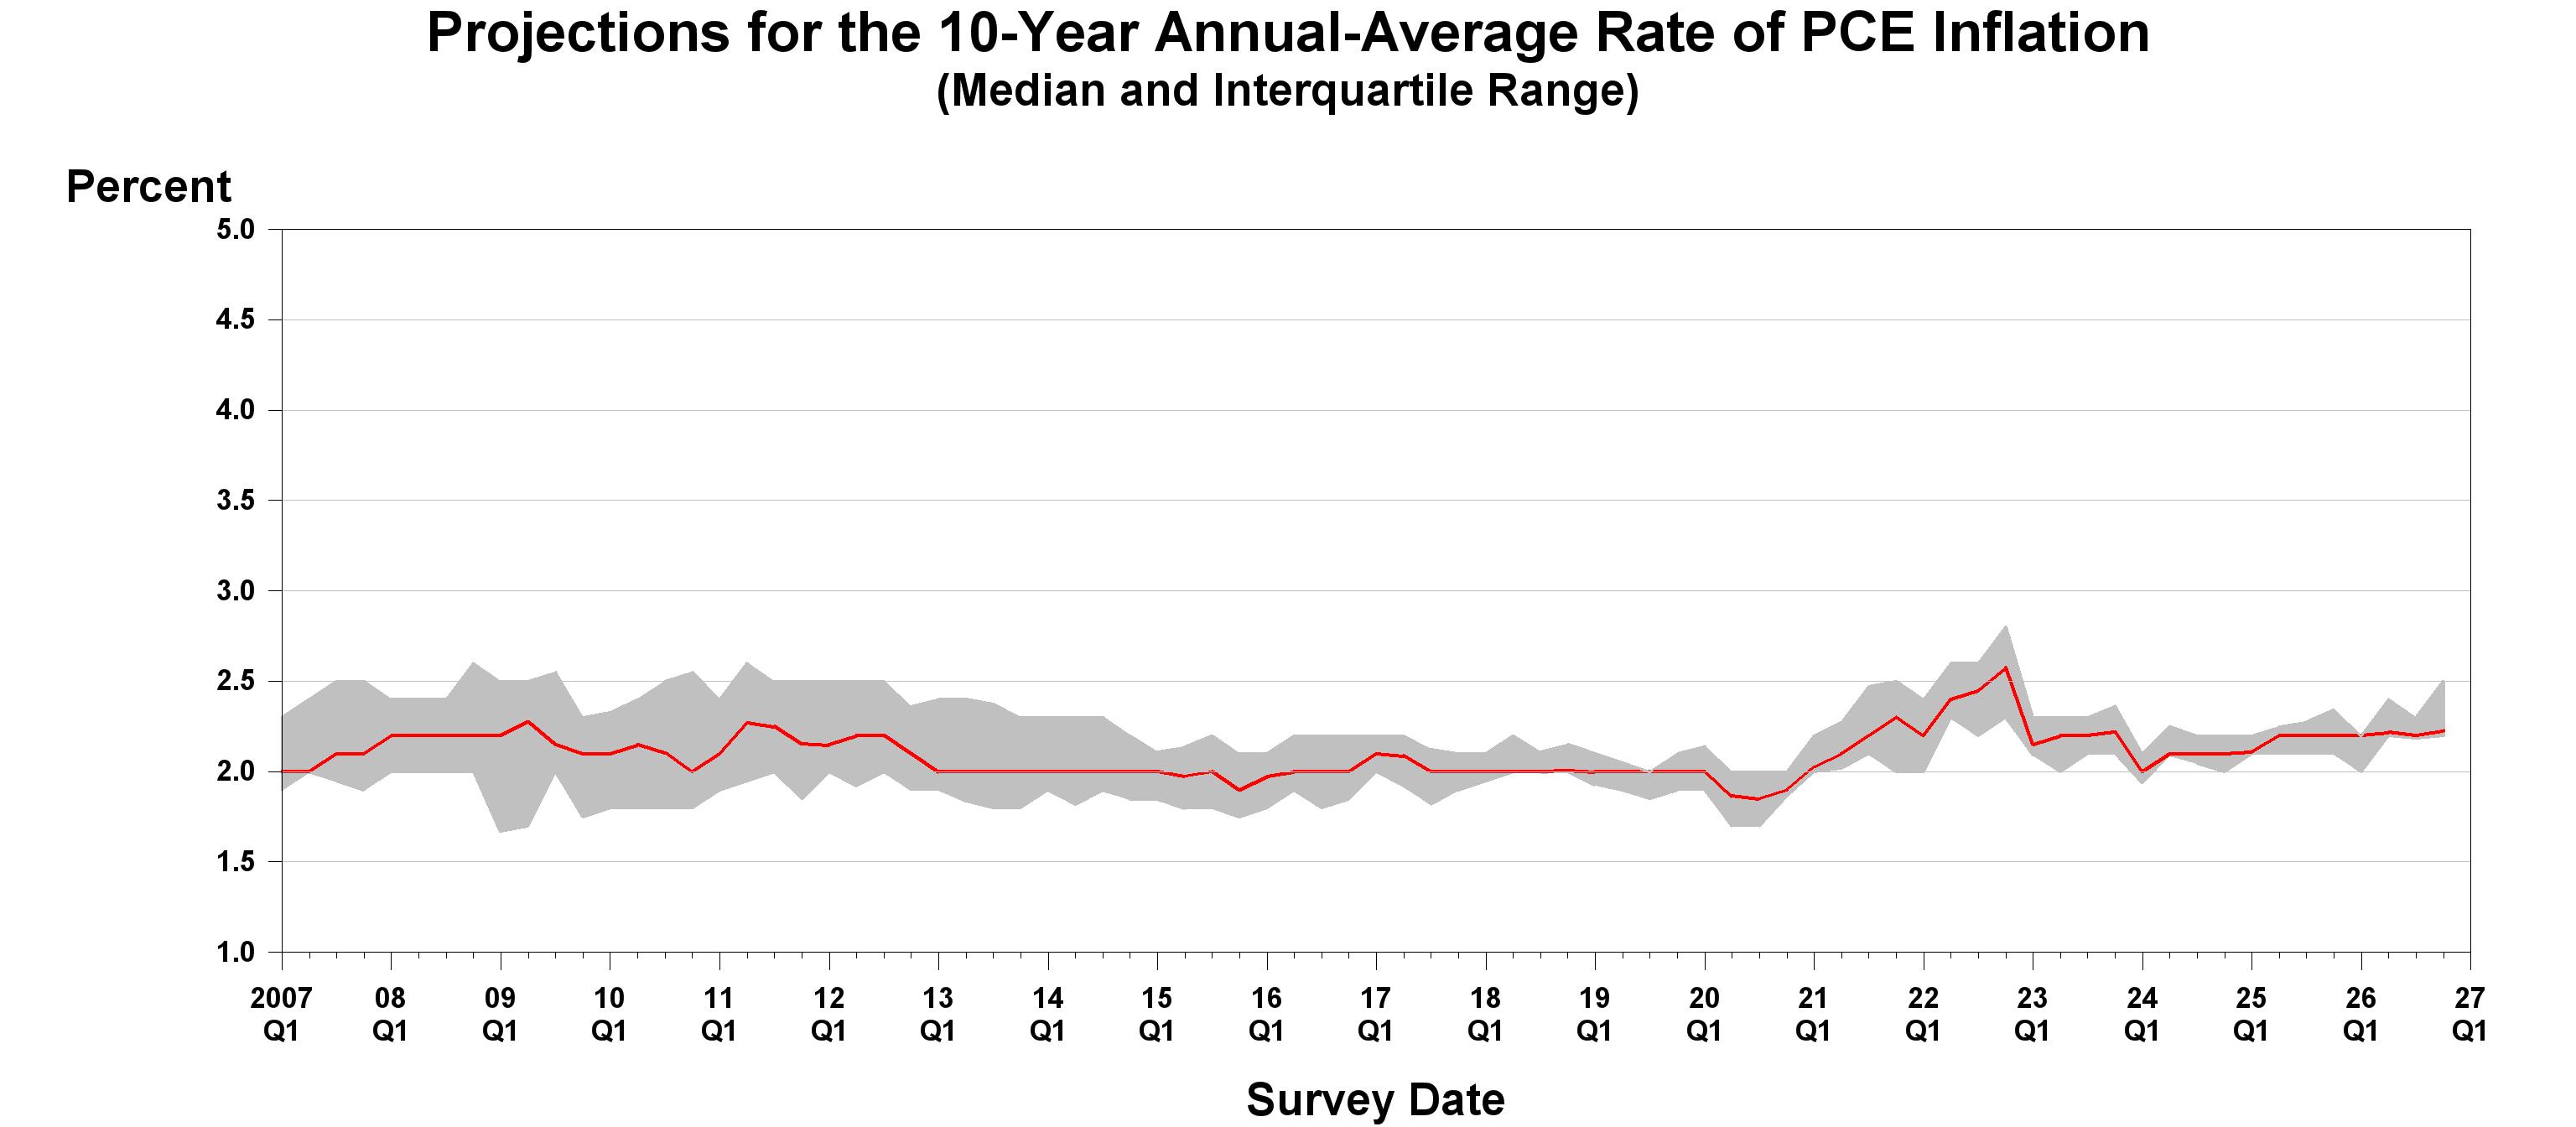
Over the next 10 years, 2026 to 2035, the forecasters predict headline CPI inflation will be at an annual-average rate of 2.49 percent. The corresponding estimate for 10-year annual-average PCE inflation is 2.23 percent. These 10-year projections are 0.19 percentage point and 0.03 percentage point, respectively, higher than those from the previous survey.
Median Short-Run and Long-Run Projections for Inflation (Annualized Percentage Points)
| Headline CPI | Core CPI | Headline PCE | Core PCE | |||||||||
|---|---|---|---|---|---|---|---|---|---|---|---|---|
| Previous | Current | Previous | Current | Previous | Current | Previous | Current | |||||
| Quarterly | ||||||||||||
| 2026:Q4 | 2.5 | 4.0 | 2.8 | 3.0 | 2.6 | 3.5 | 2.6 | 3.0 | ||||
| 2027:Q1 | 2.5 | 2.6 | 2.8 | 2.8 | 2.5 | 2.6 | 2.6 | 2.7 | ||||
| 2027:Q2 | 2.3 | 2.4 | 2.5 | 2.6 | 2.3 | 2.3 | 2.4 | 2.6 | ||||
| 2027:Q3 | 2.4 | 2.4 | 2.5 | 2.5 | 2.3 | 2.3 | 2.3 | 2.4 | ||||
| 2027:Q4 | N.A. | 2.4 | N.A. | 2.5 | N.A. | 2.2 | N.A. | 2.4 | ||||
| Q4/Q4 Annual Averages | ||||||||||||
| 2026 | 3.6 | 3.8 | 2.8 | 2.7 | 3.6 | 3.7 | 3.3 | 3.2 | ||||
| 2027 | 2.3 | 2.4 | 2.6 | 2.6 | 2.3 | 2.4 | 2.4 | 2.5 | ||||
| 2028 | 2.3 | 2.3 | 2.4 | 2.4 | 2.1 | 2.2 | 2.2 | 2.2 | ||||
| Long-Term Annual Averages | ||||||||||||
| 2026-2030 | 2.60 | 2.62 | N.A. | N.A. | 2.50 | 2.50 | N.A. | N.A. | ||||
| 2026-2035 | 2.30 | 2.49 | N.A. | N.A. | 2.20 | 2.23 | N.A. | N.A. | ||||
The charts below show the median projections (the red line) and the associated interquartile ranges (gray areas around the red line) for 10-year annual-average CPI and PCE inflation. The charts provide historical perspective on the current survey’s higher projection for 10-year CPI inflation and 10-year PCE inflation.
- Projections for the 10-Year Annual-Average Rate of CPI Inflation (chart)
- Projections for the 10-Year Annual-Average Rate of PCE Inflation (chart)
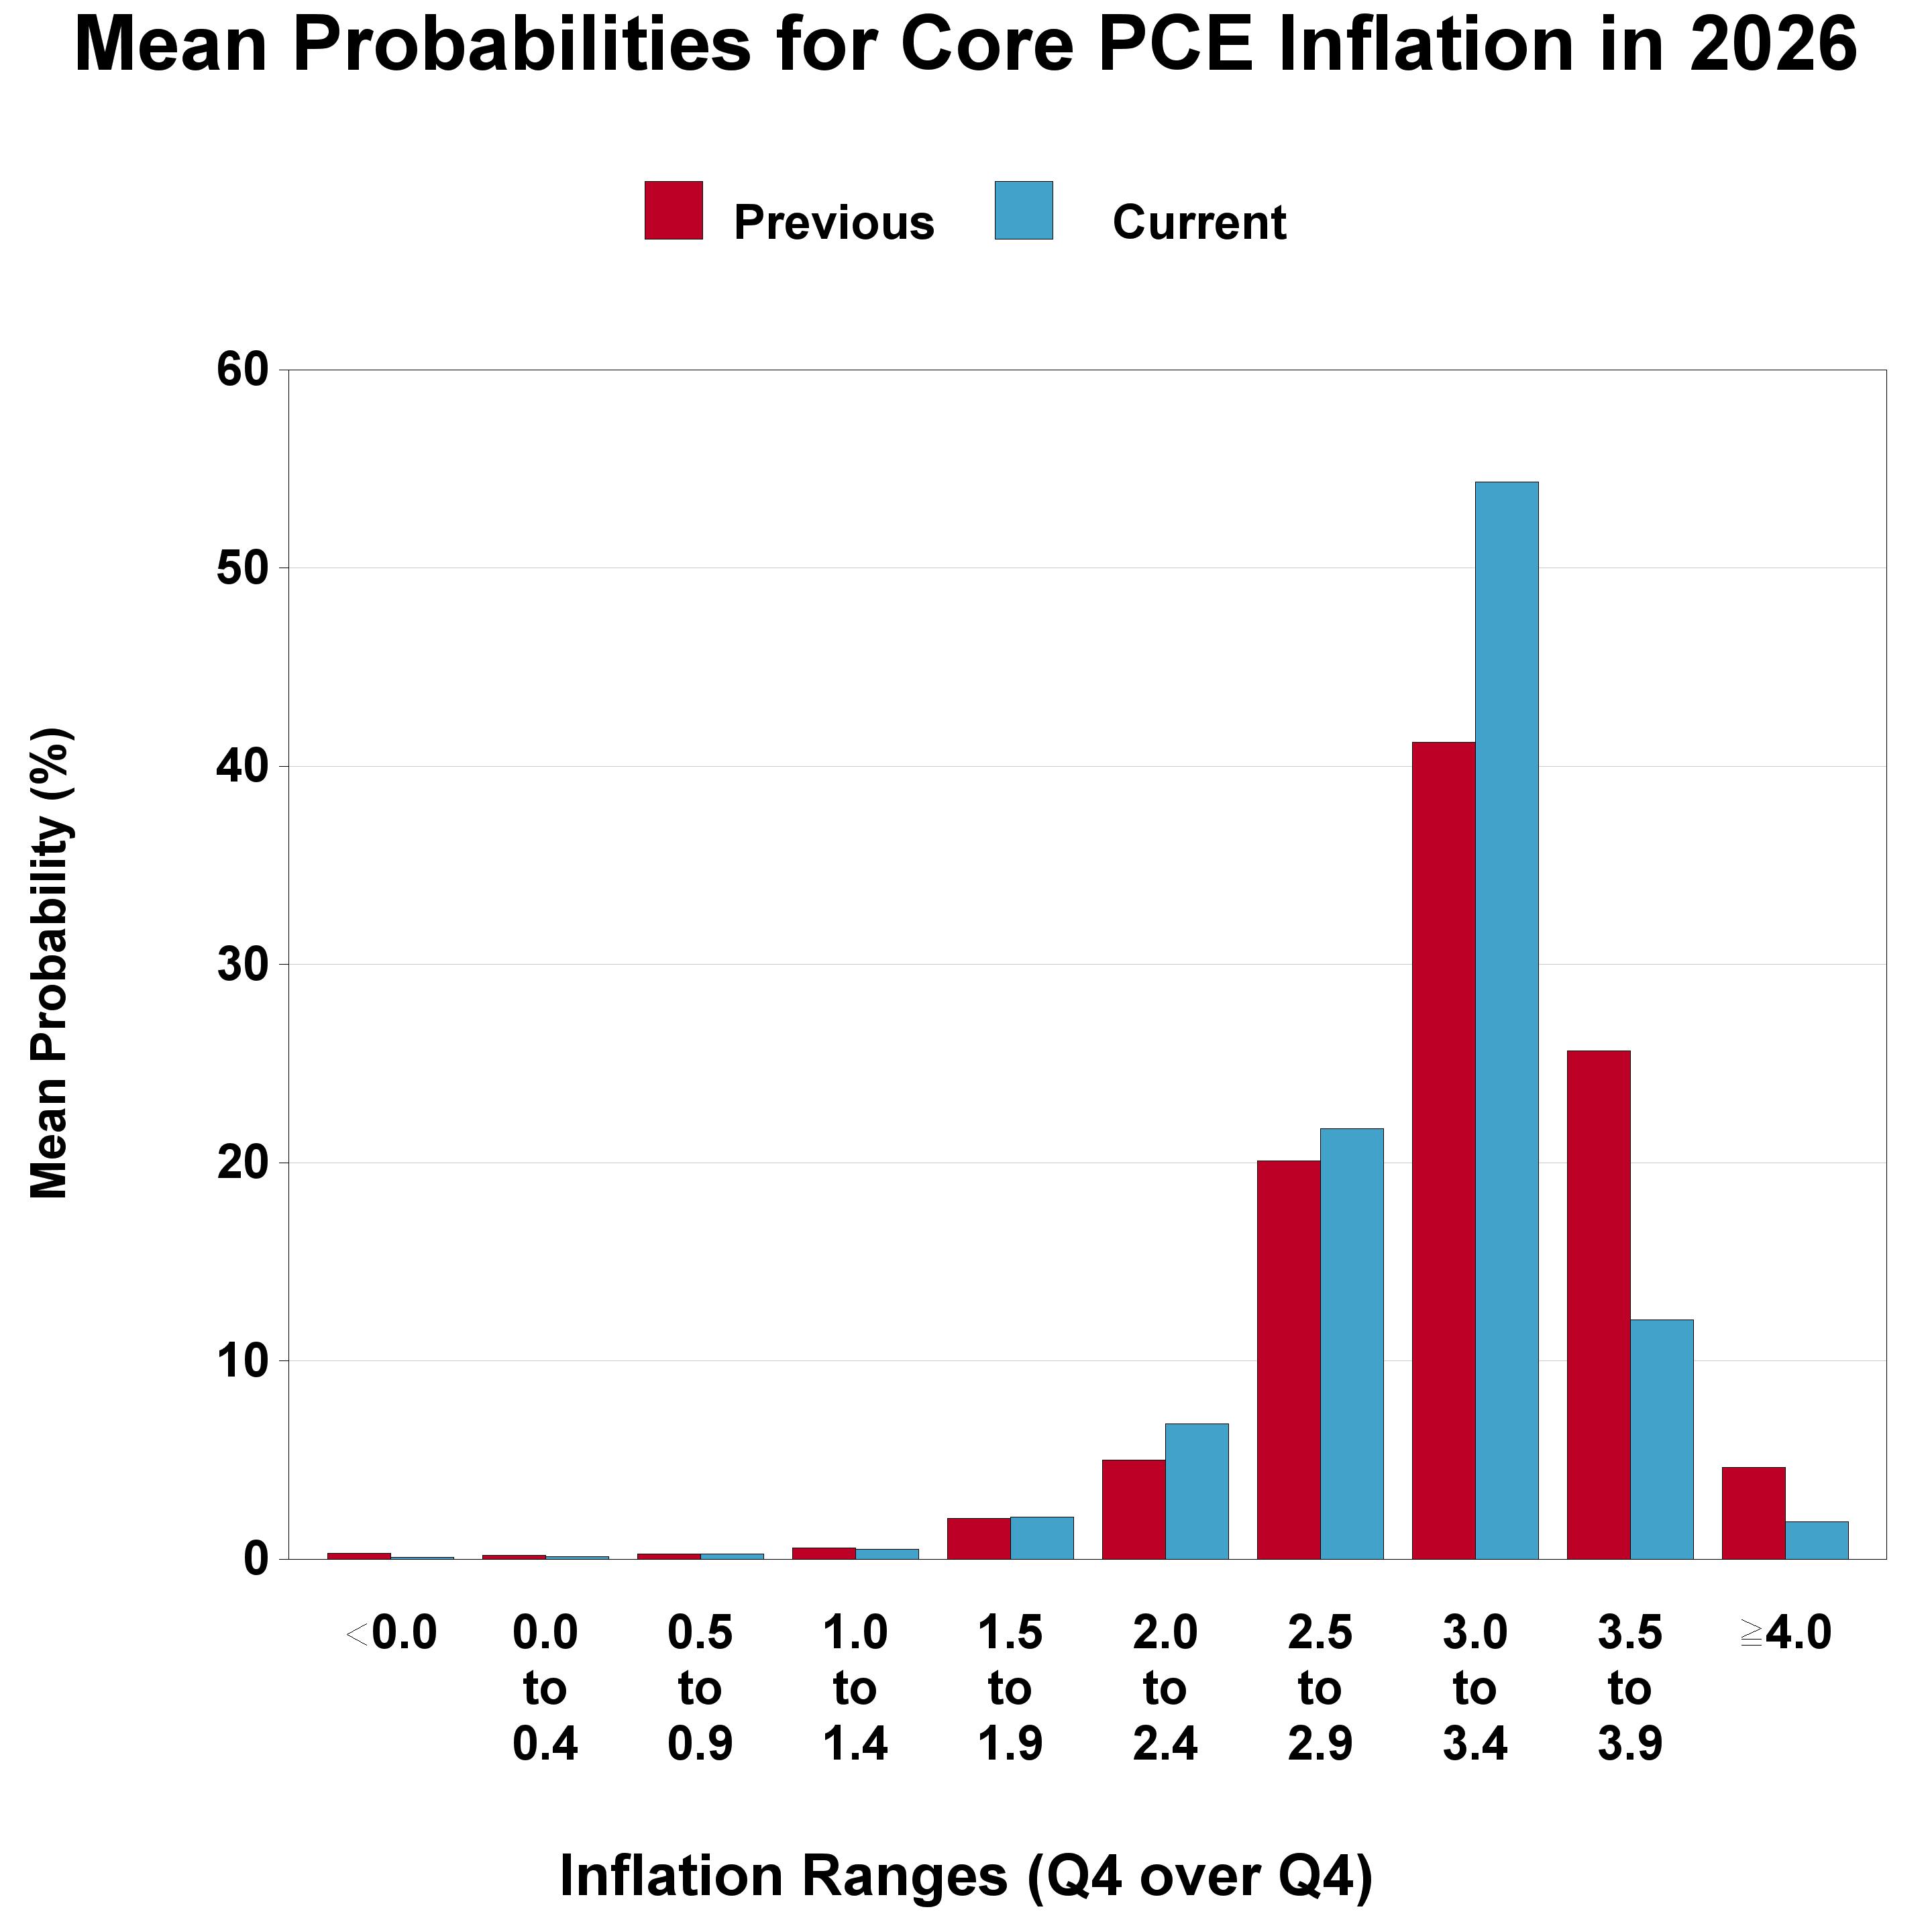
The figures below show the probabilities that the forecasters are assigning to each of 10 possible ranges for fourth-quarter over fourth-quarter core PCE inflation in 2026 and 2027. For 2026, the forecasters have raised their estimates for the probability that core PCE inflation will be between 3.0 and 3.4 percent. For 2027, the forecasters have shifted probability estimates from between 1.5 and 2.4 toward the 2.5 to 3.4 percent range.
- Mean Probabilities for Core PCE Inflation in 2026 (chart)
- Mean Probabilities for Core PCE Inflation in 2027 (chart)
Forecasters See Lower Risk of a Negative Quarter
The forecasters have reduced their estimate of the risk of a downturn in real GDP this quarter to 11.5 percent, compared with the estimate of 20.0 percent in the previous survey. The panelists have also made downward revisions to their probability estimates for the following two quarters.
Risk of a Negative Quarter (%)
Survey Means
| Quarterly data: | Previous | New |
|---|---|---|
| 2026:Q4 | 20.0 | 11.5 |
| 2027:Q1 | 21.5 | 17.4 |
| 2027:Q2 | 22.0 | 20.9 |
| 2027:Q3 | 20.8 | 22.8 |
| 2027:Q4 | N.A. | 21.8 |
Technical Notes
Moody's Aaa and Baa Historical Rates
The historical values of Moody's Aaa and Baa rates are proprietary and, therefore, not available in the data files on the Bank’s website or on the tables that accompany the survey’s complete write-up in the PDF.
Missing Historical Values
Due to the federal government shutdown, we had incomplete historical monthly data available for the October 2025 unemployment rate and the CPI. We computed the full year 2025 (for unemployment rate, CPI inflation, and core CPI inflation) historical values using interpolated October values available from Haver Analytics and provided these jump-off values to the panelists on the survey questionnaire. The panelists were permitted to use their own historical values. Some panelists used their own values; others did not.
The Federal Reserve Bank of Philadelphia thanks the following forecasters for their participation in recent surveys:
William Adams, Fifth Third Commercial Bank; Ed Al-Hussainy and Alexander Spitz, Columbia Threadneedle Investments; Scott Anderson and Doug Porter, BMO Capital Markets; Robert J. Barbera, Johns Hopkins University Center for Financial Economics; Peter Bernstein, RCF Economic and Financial Consulting, Inc.; Wayne Best and Michael Brown, Visa, Inc.; Gary Ciminero, CFA, GLC Financial Economics; Grant Collins, AIM Research, LLC; Andrew Davis, Bryn Mawr Trust; Rajeev Dhawan, Georgia State University; James Egelhof, BNP Paribas; Gabriel Ehrlich, Daniil Manaenkov, and Yinuo Zhang, RSQE, University of Michigan; Michael R. Englund, Action Economics, LLC; Tani Fukui and Shan Ahmed, MetLife Investment Management; Sacha Gelfer, Bentley University; James Glassman, Independent Economist; Ben Herzon and Patrick Newport, S&P Global Market Intelligence; Steve Kihm, Citizens Utility Board of Wisconsin; Yaniv Konchitchki, University of California, Berkeley; Thomas Lam, Independent Economist (Singapore); Matthew Luzzetti, Deutsche Bank; Brian Martin, Australia New Zealand Bank (ANZ); Robert McNab, Old Dominion University; Daniel Mershon, USAA; R. Anthony Metz, Pareto Optimal Economics, LLC; R. M. Monaco, TitanRM; Joel L. Naroff, Naroff Economics, LLC; Brendon Ogmundson, BC Real Estate Association; Panos N. Patatoukas, U.C. Berkeley, Haas School of Business; Michael Pearce, Oxford Economics USA, Inc.; Perc Pineda, Ph.D., Plastics Industry Association; Jason Prole, Capital Risk Management; Tim Quinlan, Wells Fargo; Luciano Rispoli, Advance Macro Research; Michael Roberts and Dan Roberts, Roberts Capital Advisors, LLC; Parker Ross, Arch Capital Group; Philip Rothman, East Carolina University; Allen Sinai and Noah Moudarres, Decision Economics, Inc.; Sean Snaith, University of Central Florida; Daniel Soques, University of North Carolina Wilmington; Stephen Stanley, Santander US Capital Markets; Charles Steindel, Editor, NABE Business Economics; Susan M. Sterne, Economic Analysis Associates, Inc.; Jordan Vickers and Maira Trimble, Eaton Corporation; Gary Wagner, University of Louisiana at Lafayette; Mark Zandi, Moody’s Analytics.
This is a partial list of participants. We also thank those who wish to remain anonymous.
Return to the main page for the Survey of Professional Forecasters.
Share