

There are countless data sources on our economy, but when economists want early signals about manufacturing conditions, they turn to a survey that's been delivering answers for decades. Often referred to as the “Philly Fed Index” because of its headline index, the Manufacturing Business Outlook Survey is a monthly survey that tracks changes in things like general activity, the cost of materials, and new orders among manufacturing firms in the Third Federal Reserve District.
The Philadelphia Fed recently launched new interactive dashboards and FAQ pages for the Manufacturing Business Outlook Survey and its sister product, the Nonmanufacturing Business Outlook Survey. Here are five things to know about this influential economic indicator.
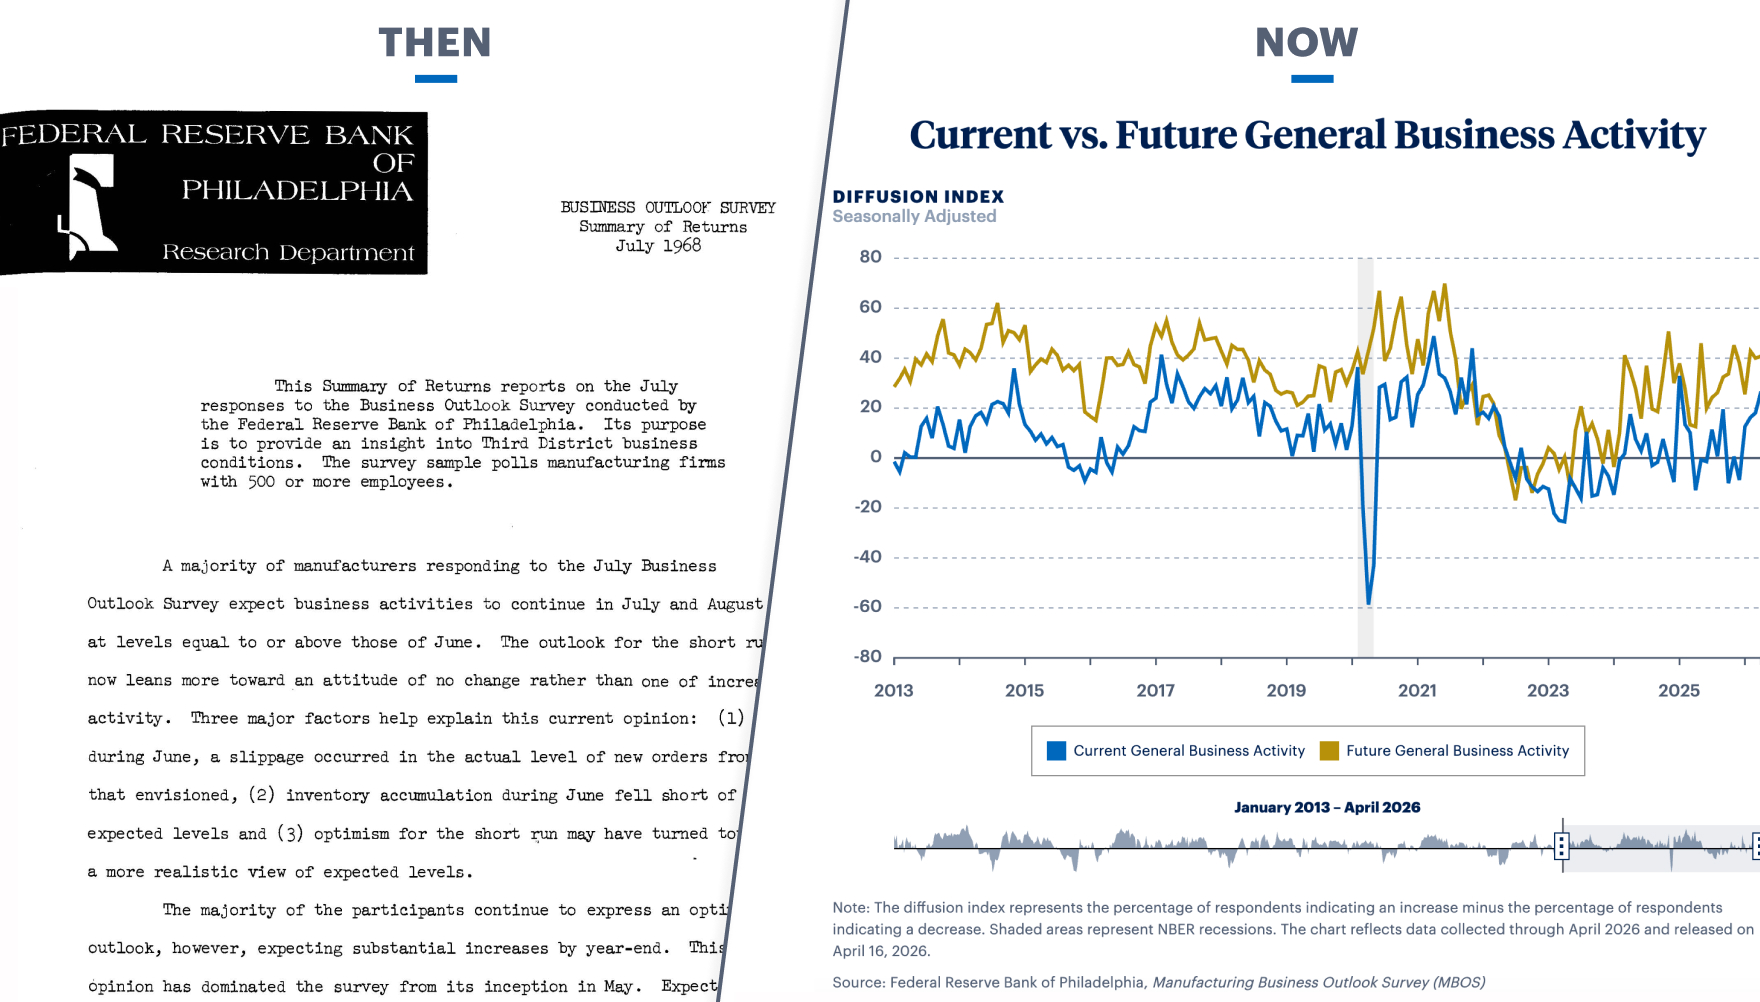
- When bell-bottoms were king, it became a thing. The Manufacturing Business Outlook Survey is the longest-running manufacturing survey by any Federal Reserve Bank. Launched in 1968, its consistent structure over decades makes it easier to track economic changes and compare business cycles. This gives economists reliable long-term data for predictions and analysis.
- It goes straight to the source for information. The survey asks manufacturing leaders in the region — owners, CEOs, and plant managers — on whether business indicators like activity, new orders, prices, and employee workweek rose, fell, or remained unchanged from the previous month. It also collects their expectations for those business indicators and capital investment plans, along with periodic questions on different topics.
- It’s an early signal on regional and national conditions. The survey can provide early signals about the U.S. economy — often weeks before official government statistics are released. Economists, investors, and the media watch it closely because manufacturing trends often predict broader economic changes, including recessions and recoveries.
- Results track economic downturns — and upswings. The survey has tracked eight recessions in its over 50-year history. When the current general activity index is negative, the economy is typically struggling. When it’s positive, the economy is typically expanding. The index has, at least on one occasion, predicted exact turning points. It went negative in December 2007 and positive in June 2009 for the first time in 18 months, dates that were later determined to match the start and end points of the Great Recession.
- It’s a trendsetter. The success of the survey has inspired Federal Reserve Banks to create their own versions, and it spawned the Nonmanufacturing Business Outlook Survey, which launched in 2011. In 2025, the Philadelphia Fed introduced the Price and Inflation Expectations Survey, which grew out of special questions first added to the manufacturing and nonmanufacturing surveys in 2015. While it's still too early to tell for sure, initial results show that reported prices changes from the Price and Inflation Expectations Survey follow U.S. inflation fairly well.
Explore the interactive data visualization.