


Employment growth has slowed considerably in the United States. After expanding by 120,000 per month during 2024, monthly payrolls grew on average by just 10,000 during 2025. At first glance, this suggested a weak labor market and perhaps even an imminent recession. However, the unemployment rate rose only somewhat during this period. Can payroll growth really remain this low without the unemployment rate rising significantly?
The answer lies in the breakeven rate, which is the rate of employment growth consistent with a stable unemployment rate. While easy to define, the breakeven rate is hard to measure because it's not directly observable. It represents a counterfactual: It's the change in employment that would occur if the unemployment rate were stable. We must therefore infer the breakeven rate from available labor market data.
This article discusses two estimators of the breakeven rate. These estimators apply different methods but reach a similar conclusion: The breakeven rate is roughly 20,000 to 35,000 jobs per month.
Conceptual Background
Breakeven estimators share a basic framework. They interpret changes in employment as the result of a mixture of shocks. One type of shock is exemplified by the Great Recession of 2007–2009, which drove the number of hires far below the number of job seekers. When the balance between hires and job seekers is disrupted, the unemployment rate changes.
Not all shocks have this effect. Consider a change in population growth. Historically, a growing population has increased the numbers of hires and job seekers proportionally. When hires adjust in line with job seekers, the unemployment rate stays constant.
The challenge for policymakers is that neither shock is perfectly observed in real time; even population growth is only measured accurately with a lag. Yet the best policy response depends on the mix of shocks. A slowdown in employment growth may signal that monetary policy needs to change to combat greater joblessness. But if the slowdown stems largely from a decline in, say, population growth, we may expect little — if any — rise in the unemployment rate.
In short, policymakers need to know: How much of the slowdown comes from recessionary shocks versus a downshift in the "normal" employment growth rate consistent with a stable unemployment rate? Breakeven estimators answer this question. The strategy is to "filter out" the variation in employment growth associated with changes in the unemployment rate and other transitory shocks. What's left is the employment growth rate that would prevail in a stable labor market. This article reviews two methods for solving this filtering problem.1
Labor Force Accounting
Before discussing the breakeven estimators, let's review some key labor force concepts. This should clarify how employment can adjust without changing the unemployment rate.
The unemployed are people currently out of work but searching for employment. The unemployed plus the employed equals the labor force. The unemployment rate is the share of the labor force that's unemployed.
A change in the number of unemployed doesn't necessarily change the unemployment rate. If the unemployed and employed grow at the same pace, the labor force grows at that pace and the unemployment rate is unchanged. This means that we can understand the employment breakeven rate as simply the rate of labor force growth consistent with a stable unemployment rate.
Labor force growth has two components: growth in the working-age population and growth in the labor force participation rate, which is the share of the population in the labor force. Over short horizons, population growth has been essentially uncorrelated with changes in the unemployment rate.2 By contrast, changes in the participation rate are at least weakly correlated with changes in the unemployment rate (Figure 1). The decision to join the labor force depends on many of the same transitory shocks affecting unemployment. For instance, suppose an interest rate increase depresses hiring and reduces an unemployed worker's probability of finding a job. This raises the unemployment rate and reduces the incentive to search for work — and thus the participation rate falls, too.3
To estimate the employment breakeven rate, we must tackle each of these components. Conceptually, population growth is the easier of the two since it is uncorrelated with changes in unemployment. If we ask what population growth would be if the unemployment rate were stable, the answer is: the same as we now observe. This means that the breakeven rate moves one for one with the population growth rate.
The same doesn't necessarily apply to the participation rate. Because changes in participation and unemployment have generally been negatively correlated, many shocks that contribute to short-run unemployment fluctuations may also affect participation. If these shocks were "shut off" — that is, if unemployment were stable — the participation rate would differ at least somewhat from what we see in the data.
Figure 1
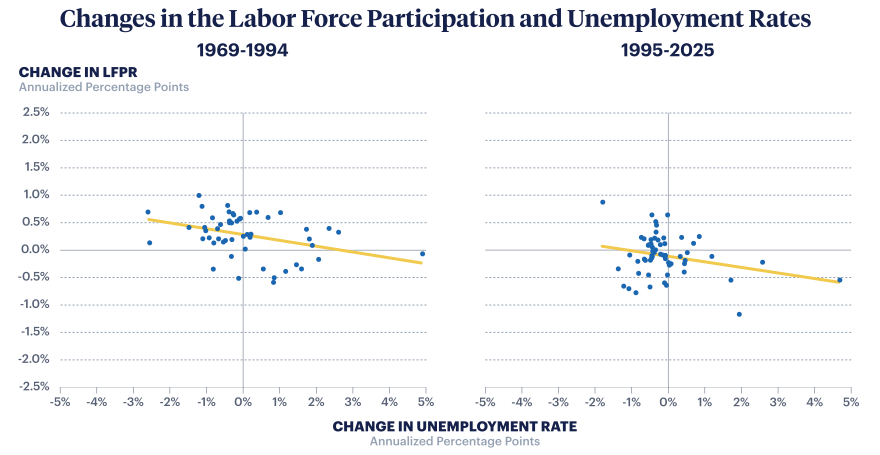
Sources: BLS Current Population Survey and Coglianese et al. (2025)
Note: This figure plots semiannual changes in the labor force participation rate against (semiannual) changes in the unemployment rate. Both variables are expressed on an annual basis. To visualize the data more easily in the period 1995–2025, the pandemic years (2020–2021) have been removed.
The upshot is that, to estimate the employment breakeven rate, we must estimate the change in the participation rate that would occur with stable unemployment. That's the task we take up below.
A Micro Approach
Here I describe a breakeven estimator built on detailed analysis of labor force participation rates. This approach uses household survey data to develop empirical models of participation decisions by men and women in narrowly defined age groups, which is why I call this a micro approach.
This approach's backbone is an influential empirical model of participation rates originally developed by staff at the Federal Reserve's Board of Governors.4 Their model expresses the participation rate of an age group (say, ages 35–39) as a function of three sets of variables.
The first set includes characteristics such as marriage rate, educational attainment, and family structure (for example, the share of households with young children). Each characteristic likely affects participation; mothers of young children, for instance, participate at a lower rate.
The second set captures important policies shaping the incentive to participate. These policies include early-retirement penalties under Social Security and the likelihood that a worker will qualify for disability insurance.
The third set captures short-run labor market fluctuations. The exact measure of labor market volatility is not crucial; what matters is that the absence of volatility (in that measure) is consistent with stable unemployment. To measure volatility, the Board staff uses the gap between employment and its long-run trend. A zero employment gap generally means stable unemployment.
Unlike the third set of variables, the first two sets are generally independent of the labor market's ups and downs. They capture determinants of the participation rate trend, which is a key input in the employment breakeven rate.
To isolate this trend component, the first step is to set the employment gap to zero. With that measure "shut off," the model's fitted value gives the predicted participation rate for each age group consistent with stable unemployment.5 The second step is to take a weighted average of these predicted values across age ranges, in which the weight is each range's population share. Note that the age distribution of the population also evolves relatively independent of current labor market conditions. These weighted averages tell us the average participation rate that would be observed without unemployment fluctuations.
The percentage change in this rate over time can be added to the percentage change in population to derive the labor force growth rate consistent with stable unemployment, which equals the employment breakeven rate. (I return to population growth later in this article.)
The Congressional Budget Office (CBO) formulates and estimates empirical participation models that build on this framework.6 The CBO's most recent analysis finds that the "potential," or trend, labor force participation rate was just under 62.5 percent in 2025 and is projected to decline by 0.1 percent per year. This isn't negligible, but it's rather small relative to recent and projected swings in population growth. The trend rate thus plays a secondary role in our breakeven estimates.
A Macro Approach
As noted above, estimating the breakeven rate is essentially a filtering problem: We need to remove the effects of certain shocks in order to isolate the trend in labor force growth consistent with stable unemployment. The micro approach does this using detailed regression models of participation rates.
This section adopts a different filtering solution: I apply standard macroeconometric techniques for separating business cycle variation (for example, changes in the unemployment rate) from other persistent shocks to the average participation rate. This macro approach complements the micro approach, but each has costs and benefits.
One advantage of the macro approach is that it doesn't require me to catalog the exact shocks and policies shaping participation, as is necessary when formulating the regressions used in the micro approach. Instead, I specify mathematically the general properties of trend growth — for instance, it's highly persistent and independent of the business cycle — and extract the portion of the change in the participation rate consistent with this description. I can implement this approach using only a few aggregate data series.
The cost is lost transparency. In the micro approach, each trend movement can be traced to a certain factor. By contrast, the macro approach picks up whatever shocks satisfy my mathematical description of trend growth. It's therefore harder to provide a narrative for the changes in the breakeven rate recovered from the macro approach.
To introduce this approach, let's return to the relationship between aggregate participation rate changes and unemployment rate changes, which I graphed in Figure 1. The vertical axis shows the (annualized) participation rate change (in percentage points), and the horizontal axis shows the (annualized) unemployment rate change (in percentage points). The left panel covers 1969–1994; the right panel spans 1995–2025.
In each panel, we can see the change in the participation rate that is associated with no change in the unemployment rate. This is where the "cloud" of data points crosses the vertical axis — the vertical intercept. Conceptually, this intercept is related to the breakeven rate. However, we don't want to fix the breakeven rate over a 25- or 30-year period, especially since it's clear that the intercept has evolved over time. It is higher, for instance, in the earlier period (1969–1994), which reflects in part the downward trend in male participation since the 1960s.7
Estimating a time-varying intercept is a standard macroeconometric problem. We allow the intercept to have transitory and persistent components. The latter is persistent in the sense that its current value depends explicitly on its past value. By contrast, the transitory component's current value is independent of its history. The persistent component is meant to capture labor supply factors that adjust slowly over time, such as the demographic and policy variables highlighted by the micro approach. The transitory component is meant to capture, among other factors, measurement error in the survey data used to estimate the participation rate.8
Figure 2
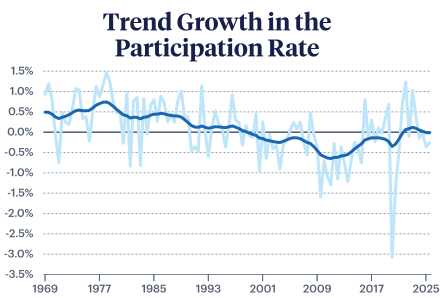
Sources: BLS Current Population Survey and
author's calculations
Note: The dark blue line shows the estimate of trend
growth in the participation rate. The light blue line
shows transitory shocks around this trend. Each series
is expressed as an annualized percentage change.
Both components vary significantly in my estimated results (Figure 2). The transitory portion is substantial and reflects very short-lived movements in the participation rate. Peering through this "noise," however, there's clear evidence of a slower-moving trend, which is the persistent component. Since the transitory part is so volatile, the persistent component's current position provides the most insight into the near-term breakeven rate. The current value is nearly zero (more precisely, it's ‑0.015 percent). This is lower than the micro approach estimate, but the two approaches agree that changes in the trend rate don't significantly contribute to the current employment growth breakeven rate.
A few other aspects of the persistent component are noteworthy. First, it has generally trended down since the late 1970s, likely due to the waning effect of the baby boom generation's previous entry into the labor force. By 2000, trend growth in the participation rate is estimated to have turned negative. This coincides with the peak in female labor force participation, which has trended downward since then.9 The trend's low 2010s level may surprise us, but it makes sense: The participation rate fell almost continuously in 2011–2015 even as the unemployment rate came down. The subsequent steady climb in participation is a signal that the trend rate recovered thereafter.10
Population Growth
To review, the employment growth breakeven rate is the labor force growth rate that would be realized with stable unemployment. Labor force growth has two parts: the participation rate growth and population growth. The prior section provided participation growth estimates consistent with stable unemployment. What remains is to estimate current population growth.
Population growth has been unusually volatile (Figure 3). It rose abruptly in 2022 and was higher still in 2023. The 1.2 percent rate in 2023 was the highest in over 15 years. Growth began slowing in 2024 and is estimated to have fallen to around 0.65 percent in 2025. Changes in immigration flows drive these ups and downs.
Figure 3
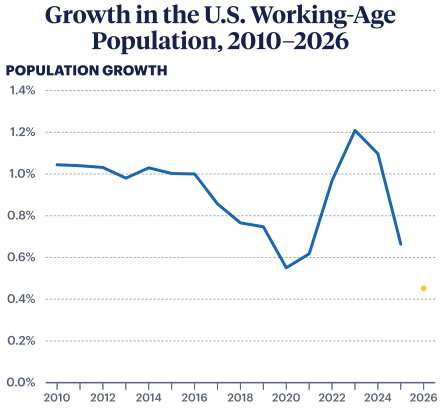
Sources: Coglianese et al. (2025) and the Bureau of
Labor Statistics
Note: The working-age population covers all ages 16
and up. The yellow dot shows the current estimate
for 2026.
Unauthorized Immigration
The most important contributor to recent swings in population growth is net unauthorized immigration, which is the difference between unauthorized immigrant inflows into the United States and outflows from the United States. Inflows include those who encounter Department of Homeland Security (DHS) personnel and are either paroled into the United States on humanitarian grounds or released with an order to appear in immigration court. In addition, some entrants evade DHS personnel.11 Outflows include deportations, removals related to withdrawn Temporary Protected Status, and voluntary emigration.
Net unauthorized immigration rose sharply in 2021–2023 but fell just as rapidly in 2024–2025. As a share of the U.S. population, net unauthorized immigration climbed from under 0.1 percent in 2020 to over 0.7 percent by 2023 (Figure 4). Between 5 and 6 million unauthorized immigrants entered the United States in these years. By 2025, however, net unauthorized immigration had turned negative: More unauthorized departed the United States than entered.
The exact 2025 figure is still debated. Based on data through last fall, the CBO estimated that net unauthorized immigration in 2025 was ‑365,000; that is, outflows exceeded inflows by 365,000.12 Researchers within the Federal Reserve System have analyzed more up-to-date data from immigration courts, which oversee most removals.13 (These data are available for all of 2025.) They find that net unauthorized immigration last year was ‑550,000. A Brookings Institution analysis concludes that net unauthorized immigration was at least as low as ‑520,000 and perhaps significantly lower.14
Figure 4
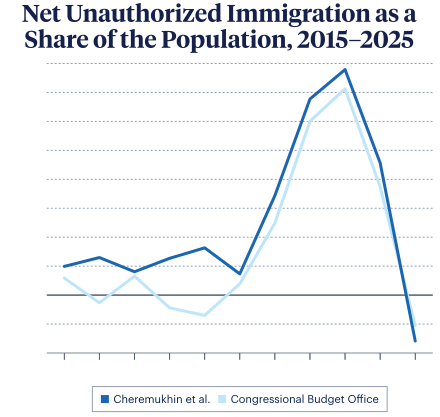
Sources: Congressional Budget Office (2026) and
Cheremukhin et al. (2026)
Note: These estimates of net unauthorized immigration
cover all ages. Therefore, they are expressed relative to
total population. The CBO provides more detailed
estimates by age, which can be used to derive net
unauthorized immigration among ages 16 and up.
Dividing the latter by the working-age population yields
essentially the same results as shown here.
Legal Immigration
In addition to the unauthorized, there are two main immigrant categories. The first consists of immigrants on a temporary visa, such as temporary workers (for example, H1B holders and H2A farm workers) and students. The second consists of legal permanent residents (LPRs), or green card holders. The number who enter the United States on a temporary visa is very large but nearly balanced by the number who exit. As a result, net immigration of LPRs is by far the larger of the two. Historically, it has also been relatively stable: Net LPR immigration rose only slightly between 2017–2019 and 2022–2024.
Final net LPR immigration estimates aren't yet available for 2025, but indicators point to a decline from a year earlier. For example, based on available U.S. Department of State data, I estimate that immigrant visa issuance in 2025 fell by 70,000 (or 10 percent). This visa is required for foreign applicants to enter the United States as permanent residents, and visa issuance and net LPR immigration have typically moved one for one.15 This decline will be amplified by the pause that was placed on immigrant visa issuance to residents of 75 countries in January of this year.
Although 2026 may bring further declines, net LPR immigration as of the end of 2025 remained at a relatively high level. Even after adjusting the CBO's figures for the reduction in immigrant visa issuance, net LPR immigration is estimated to be 790,000 in 2025. This is on par with its prepandemic average.16
Total Immigration and Population Growth
All told, net immigration in 2025 is estimated to have been between 140,000 and 325,000. This range combines CBO figures on legal immigration (adjusted for recent changes in immigrant visas) with the estimates of net unauthorized immigration.
Net immigration will remain low this year, but its exact pace is uncertain. Updated Census Bureau estimates assume net immigration will come in at around 320,000.17 These assumptions imply an annual population growth rate of 0.4 percent. However, reasonable alternative assumptions regarding immigration flows imply still lower growth. The Brookings Institution analysis anticipates more significant outflows of the unauthorized, driven by stricter enforcement. According to Board of Governors staff, these projections imply a growth rate of 0.15 percent this year.18
Employment Breakeven Rate
I can now stitch together an estimate of the employment breakeven rate. I assume population growth is halfway between the rate implied by Census Bureau data (0.4 percent per year) and the lower rate (0.15 percent per year) based on a steeper decline in the unauthorized population. This is added to the rate of growth in the labor force participation rate, which I take to be the average of the estimates from the micro and macro approaches. Given the employment level at the start of this year, this breakeven rate of growth represents an increase in employment of about 28,000 per month.19 This falls to 21,000 if I use the trend rate from the micro approach; it rises to 35,000 if I use the macro approach. This represents a significant decline even relative to the prepandemic years, when the rate was 80,000 per month.
What's more, the breakeven rate will likely fall further absent a reversal in net immigration. The reason: The native-born working-age population is growing older, reflecting lower fertility and mortality rates. Indeed, the CBO projects that population growth excluding net immigration will be negative by 2030. In this environment, negative employment growth will no longer necessarily signal a weak labor market.
References
Aaronson, Stephanie, Bruce Fallick, Andrew Figura, et al. "The Recent Decline in the Labor Force Participation Rate and Its Implications for Potential Labor Supply," Brookings Papers on Economic Activity, 1 (2006), pp. 69–154, https://doi.org/10.1353/eca.2006.0012.
Basso, Gaetano, Francesco D'Amuri, and Giovanni Peri. "Immigrants, Labor Market Dynamics, and Adjustment to Shocks in the Euro Area," IMF Economic Review, 67 (2019), pp. 528–572, https://doi.org/10.1057/s41308-019-00082-4.
Cadena, Brian, and Brian Kovak. "Immigrants Equilibrate Local Labor Markets: Evidence from the Great Recession," American Economic Journal: Applied Economics, 8:1 (2016), pp. 257–290, https://doi.org/10.1257/app.20140095.
Cajner, Tomaz, John Coglianese, and Joshua Montes. "The Long-Lived Cyclicality of the Labor Force Participation Rate," Review of Economics and Statistics (forthcoming), pp. 1–47, https://doi.org/10.1162/REST.a.1631.
Cheremukhin, Anton, Daniel Wilson, and Xiaoqing Zhou. "Break-Even Employment Declines as Unauthorized Immigration Outflows Continue," Federal Reserve Bank of Dallas, March 31, 2026, https://www.dallasfed.org/research/economics/2026/0331.
Coglianese, John, Seth Murray, and Christopher Nekarda. "Harmonized Population and Labor Force Statistics," Finance and Economics Discussion Series 2025-057 (2025), Board of Governors of the Federal Reserve System, https://www.federalreserve.gov/econres/feds/files/2025057pap.pdf.
Congressional Budget Office. "The Demographic Outlook: 2026–2056," January 7, 2026, https://www.cbo.gov/publication/61879.
Edelberg, Wendy, Stan Veuger, and Tara Watson. "Macroeconomic Implications of Immigration Flows in 2025 and 2026: January 2026 Update," American Enterprise Institute, January 13, 2026, https://www.brookings.edu/articles/macroeconomic-implications-of-immigration-flows-in-2025-and-2026-january-2026-update/.
Elsby, Michael, Bart Hobijn, and Ayşegül Şahin. "On the Importance of the Participation Margin for Labor Market Fluctuations," Journal of Monetary Economics, 72 (2015), pp. 64–82, https://doi.org/10.1016/j.jmoneco.2015.01.004.
Karahan, Fatih, Benjamin Pugsley, and Ayşegül Şahin. “Demographic Origins of the Start-up Deficit,” American Economic Review, 114:7 (2024), pp. 1986–2023, https://doi.org/10.1257/aer.20210362.
Murray, Seth, and Ivan Vidangos. "Labor Force Growth, Breakeven Employment, and Potential GDP Growth," FEDS Notes. Washington: Board of Governors of the Federal Reserve System, April 2, 2026, https://doi.org/10.17016/2380-7172.4045.
Topoleski, Julie. "CBO's Long-Term Projections of Labor Force Participation Rates," Presentation at the National Bureau of Economic Research's Summer Institute 2023: Economics of Social Security, July 26, 2023, https://www.cbo.gov/publication/59407.
United States Census Bureau. "New Population Estimates Show Historic Decline in Net International Migration," Census Blog, January 27, 2026, https://www.census.gov/newsroom/blogs/random-samplings/2026/01/historic-decline-in-net-international-migration.html.
Wilson, Daniel, and Xiaoqing Zhou. "The Impacts of Unauthorized Immigration on U.S. Labor and Housing Markets: New Evidence from Administrative Microdata," Federal Reserve Bank of Dallas Working Paper 2607 (2026), https://doi.org/10.24149/wp2607.
- The views expressed here are solely those of the author and do not necessarily reflect the views of the Federal Reserve Bank of Philadelphia or the Federal Reserve System.
- Rather than use a breakeven estimate to assess whether the unemployment rate is likely to rise, why not just monitor, and respond to, changes in the unemployment rate? In part because labor market variables are unavoidably measured with error. One or two months of higher unemployment does not necessarily portend a downturn. For this reason, the FOMC's Statement on Longer-Run Goals and Monetary Policy Strategy stresses that the Committee consults a wide range of indicators. In this context, breakeven estimates can complement other indicators.
- Unanticipated increases in population growth can have a limited effect on the unemployment rate because hires rise to "absorb" the inflow of new workers. See Wilson and Zhou (2026) on the effects of recent variation in population growth and Karahan et al. (2024) on the link between population growth and business start-ups. Conversely, though, population growth — namely, immigration — can respond to labor market conditions. See Cadena and Kovak (2016) for U.S. evidence and Basso et al. (2019) on the euro area. Despite this, overall population growth over short intervals appears to be almost independent of the unemployment rate.
- However, workers laid off in a downturn tend to have more employment experience and search more to find new work. This mitigates the fall in average participation. As a result, its correlation with the unemployment rate is statistically significant but not strong; see Elsby et al. (2015). Still, large negative shocks, such as the 2007–2009 Great Recession and the COVID-19 pandemic, do lower participation.
- See Aaronson et al. (2006).
- As the actual employment gap converges to zero over time, the actual participation rate will converge to this trend rate.
- See Topoleski (2023).
- By contrast, the correlation of the participation and unemployment rates is roughly the same in both periods. Put another way, the slope of this relationship seems broadly stable (although it is less precisely estimated in 1995–2025). Note that the micro approach also assumes that the slope in each age group's regression model is fixed over time.
- The nearest analogue to the transitory component in the micro approach is the residual in the participation rate regressions.
- Even in the 2000s, population growth was high enough to ensure that the breakeven rate of employment growth was positive despite the downward trend in the participation rate.
- This pattern might also be interpreted as a delayed response of participation to the earlier rise in the unemployment rate. See Cajner et al. (forthcoming) for evidence on this point. To capture these richer cyclical dynamics, one could include lags in the unemployment rate in the statistical model.
- The number of immigrants who do not encounter border officers is estimated by DHS based, in part, on sightings of unauthorized immigrants (by DHS personnel) and other evidence of foot traffic at the border. Based on these figures, the CBO found that 10–15 percent of recent unauthorized immigrant inflows did not encounter border officers.
- Unlike other estimates reported here, the CBO figure accounts for transitions from authorized to unauthorized status (that is, visa overstay) and vice versa (that is, granting of asylum). However, these two categories nearly cancel each other out, so their effect on net unauthorized immigration is negligible.
- See Wilson and Zhou (2026) and Cheremukhin et al. (2026). The court records were obtained by the Transactional Records Access Clearinghouse (TRAC) at Syracuse University. Wilson and Zhou supplement TRAC data with estimates of deportations under "expedited removal," which bypasses the courts. The latter applies to, among others, immigrants who avoided detection at the border.
- This figure is based on the midpoint of ranges in Edelberg et al. (2026). However, it only captures that portion of voluntary emigration by the unauthorized that exceeds what they describe as the "normal" level of outflows. For this reason, it should be seen as an upper bound on net unauthorized immigration.
- Data on immigrant visa issuance is available through September 2025. I assume the issuance rate in the third quarter (July–September) carried over to the fourth quarter (October–December).
- In place of the CBO estimate for 2025, this adjustment uses the predicted change in LPR immigration based on the latter's relationship with changes in immigrant visa issuance.
- See U.S. Census Bureau (2026).
- See Murray and Vidangos (2026).
- The breakeven rate is typically compared against employment growth in the Bureau of Labor Statistics (BLS) payroll survey, which is a survey of establishments. Therefore, I use here the December 2025 payroll estimate of employment. However, the labor force data are taken instead from the BLS survey of households, known as the Current Population Survey. At an annual frequency, these two employment growth estimates move nearly one for one (with some exceptions, such as in 2023).