Price and Inflation Expectations Survey
2026 Q2 Report
View a PDF version of this report
Note: Survey responses were collected from May 11 to May 21.
Firms’ Expectations of Price Growth Are Mixed Relative to Last Quarter
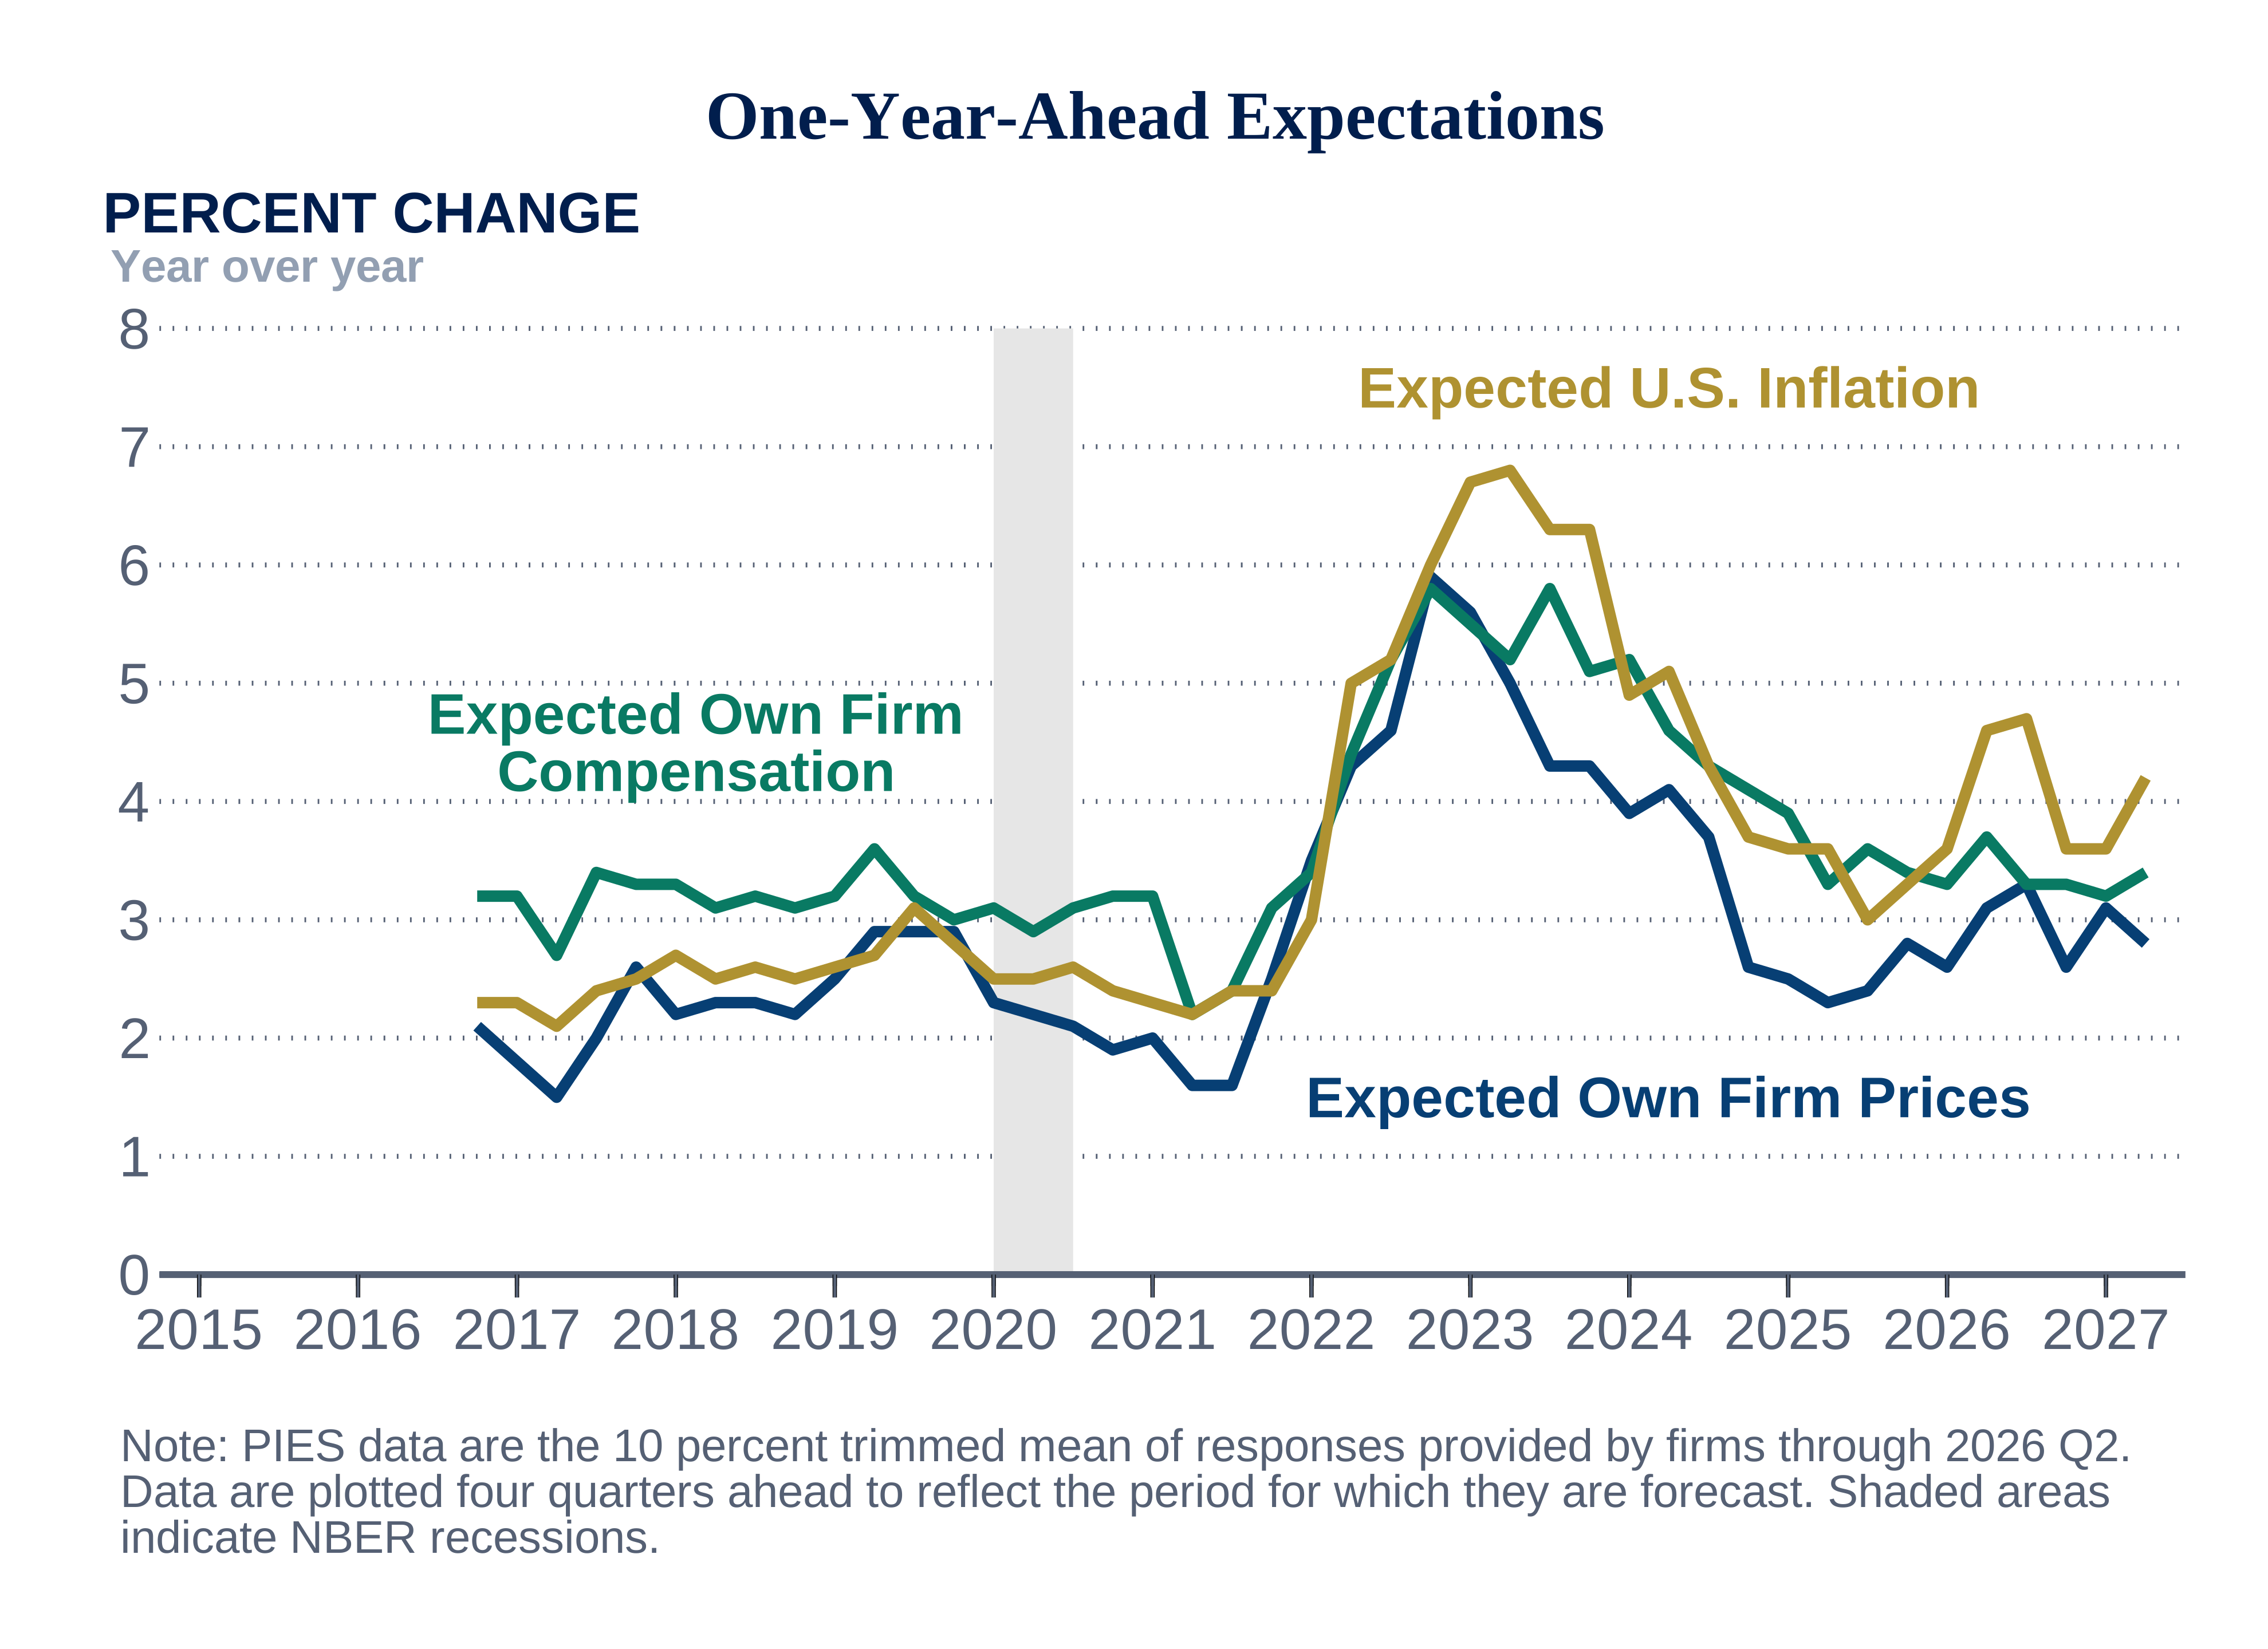
Compared with the first quarter of 2026, Third District firms reported in the second quarter of 2026 that expected increases for their own prices over the next four quarters moved down, while their expectations for U.S. inflation moved up. Their expectations for compensation ticked up but remain near pre-pandemic levels. Firms reported a larger increase in their own prices over the past year compared with last quarter.
Firms Expect Smaller Increase in Own Prices and Slight Rise in Compensation Relative to Last Quarter
For the second quarter of 2026 through the second quarter of 2027, the firms’ mean forecast for their own prices was for an increase of 2.8 percent, down from 3.1 percent last quarter. Firms expected compensation costs per employee to rise 3.4 percent over the same period, up slightly from the 3.2 percent they expected last quarter. The mean forecast for U.S. inflation rose from last quarter.
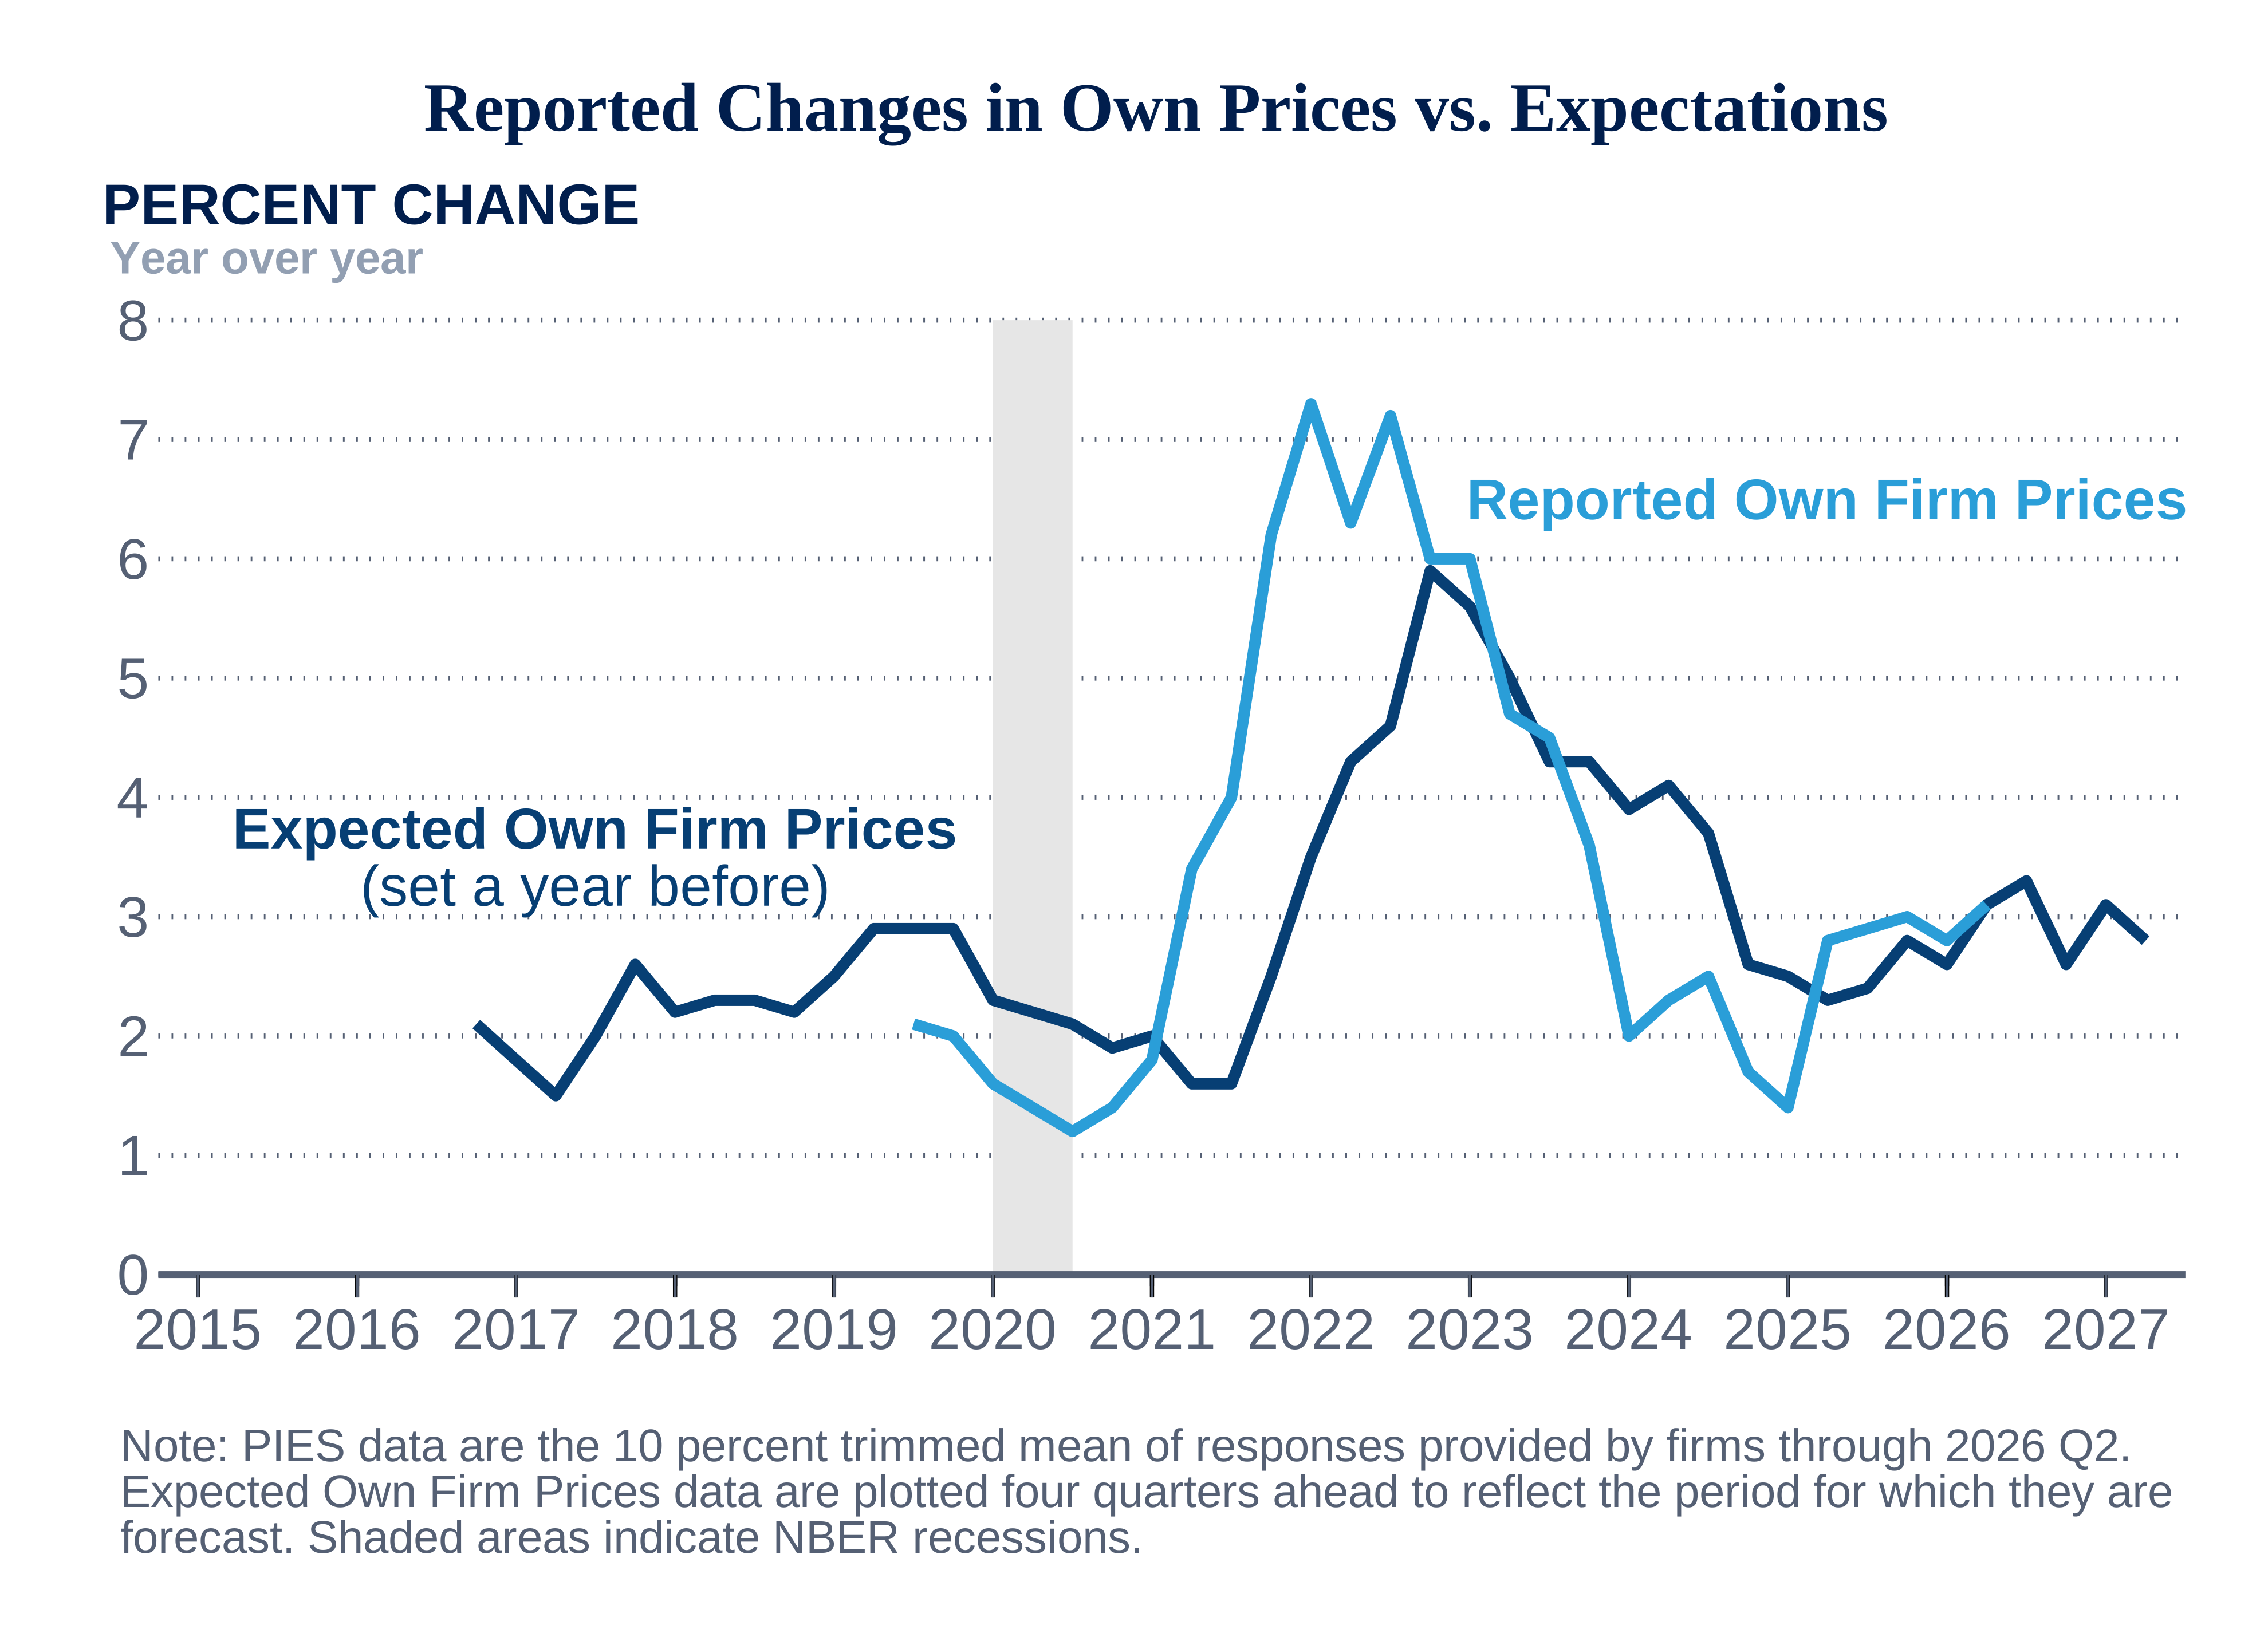
Firms Expect Smaller Price Increases Compared with Their Current Price Growth
Looking back over the past year (the second quarter of 2025 to the second quarter of 2026), firms reported that the prices they received for their own goods and services rose 3.1 percent, up from the 2.8 percent they reported last quarter and higher than the 2.8 percent growth they expect over the next four quarters.
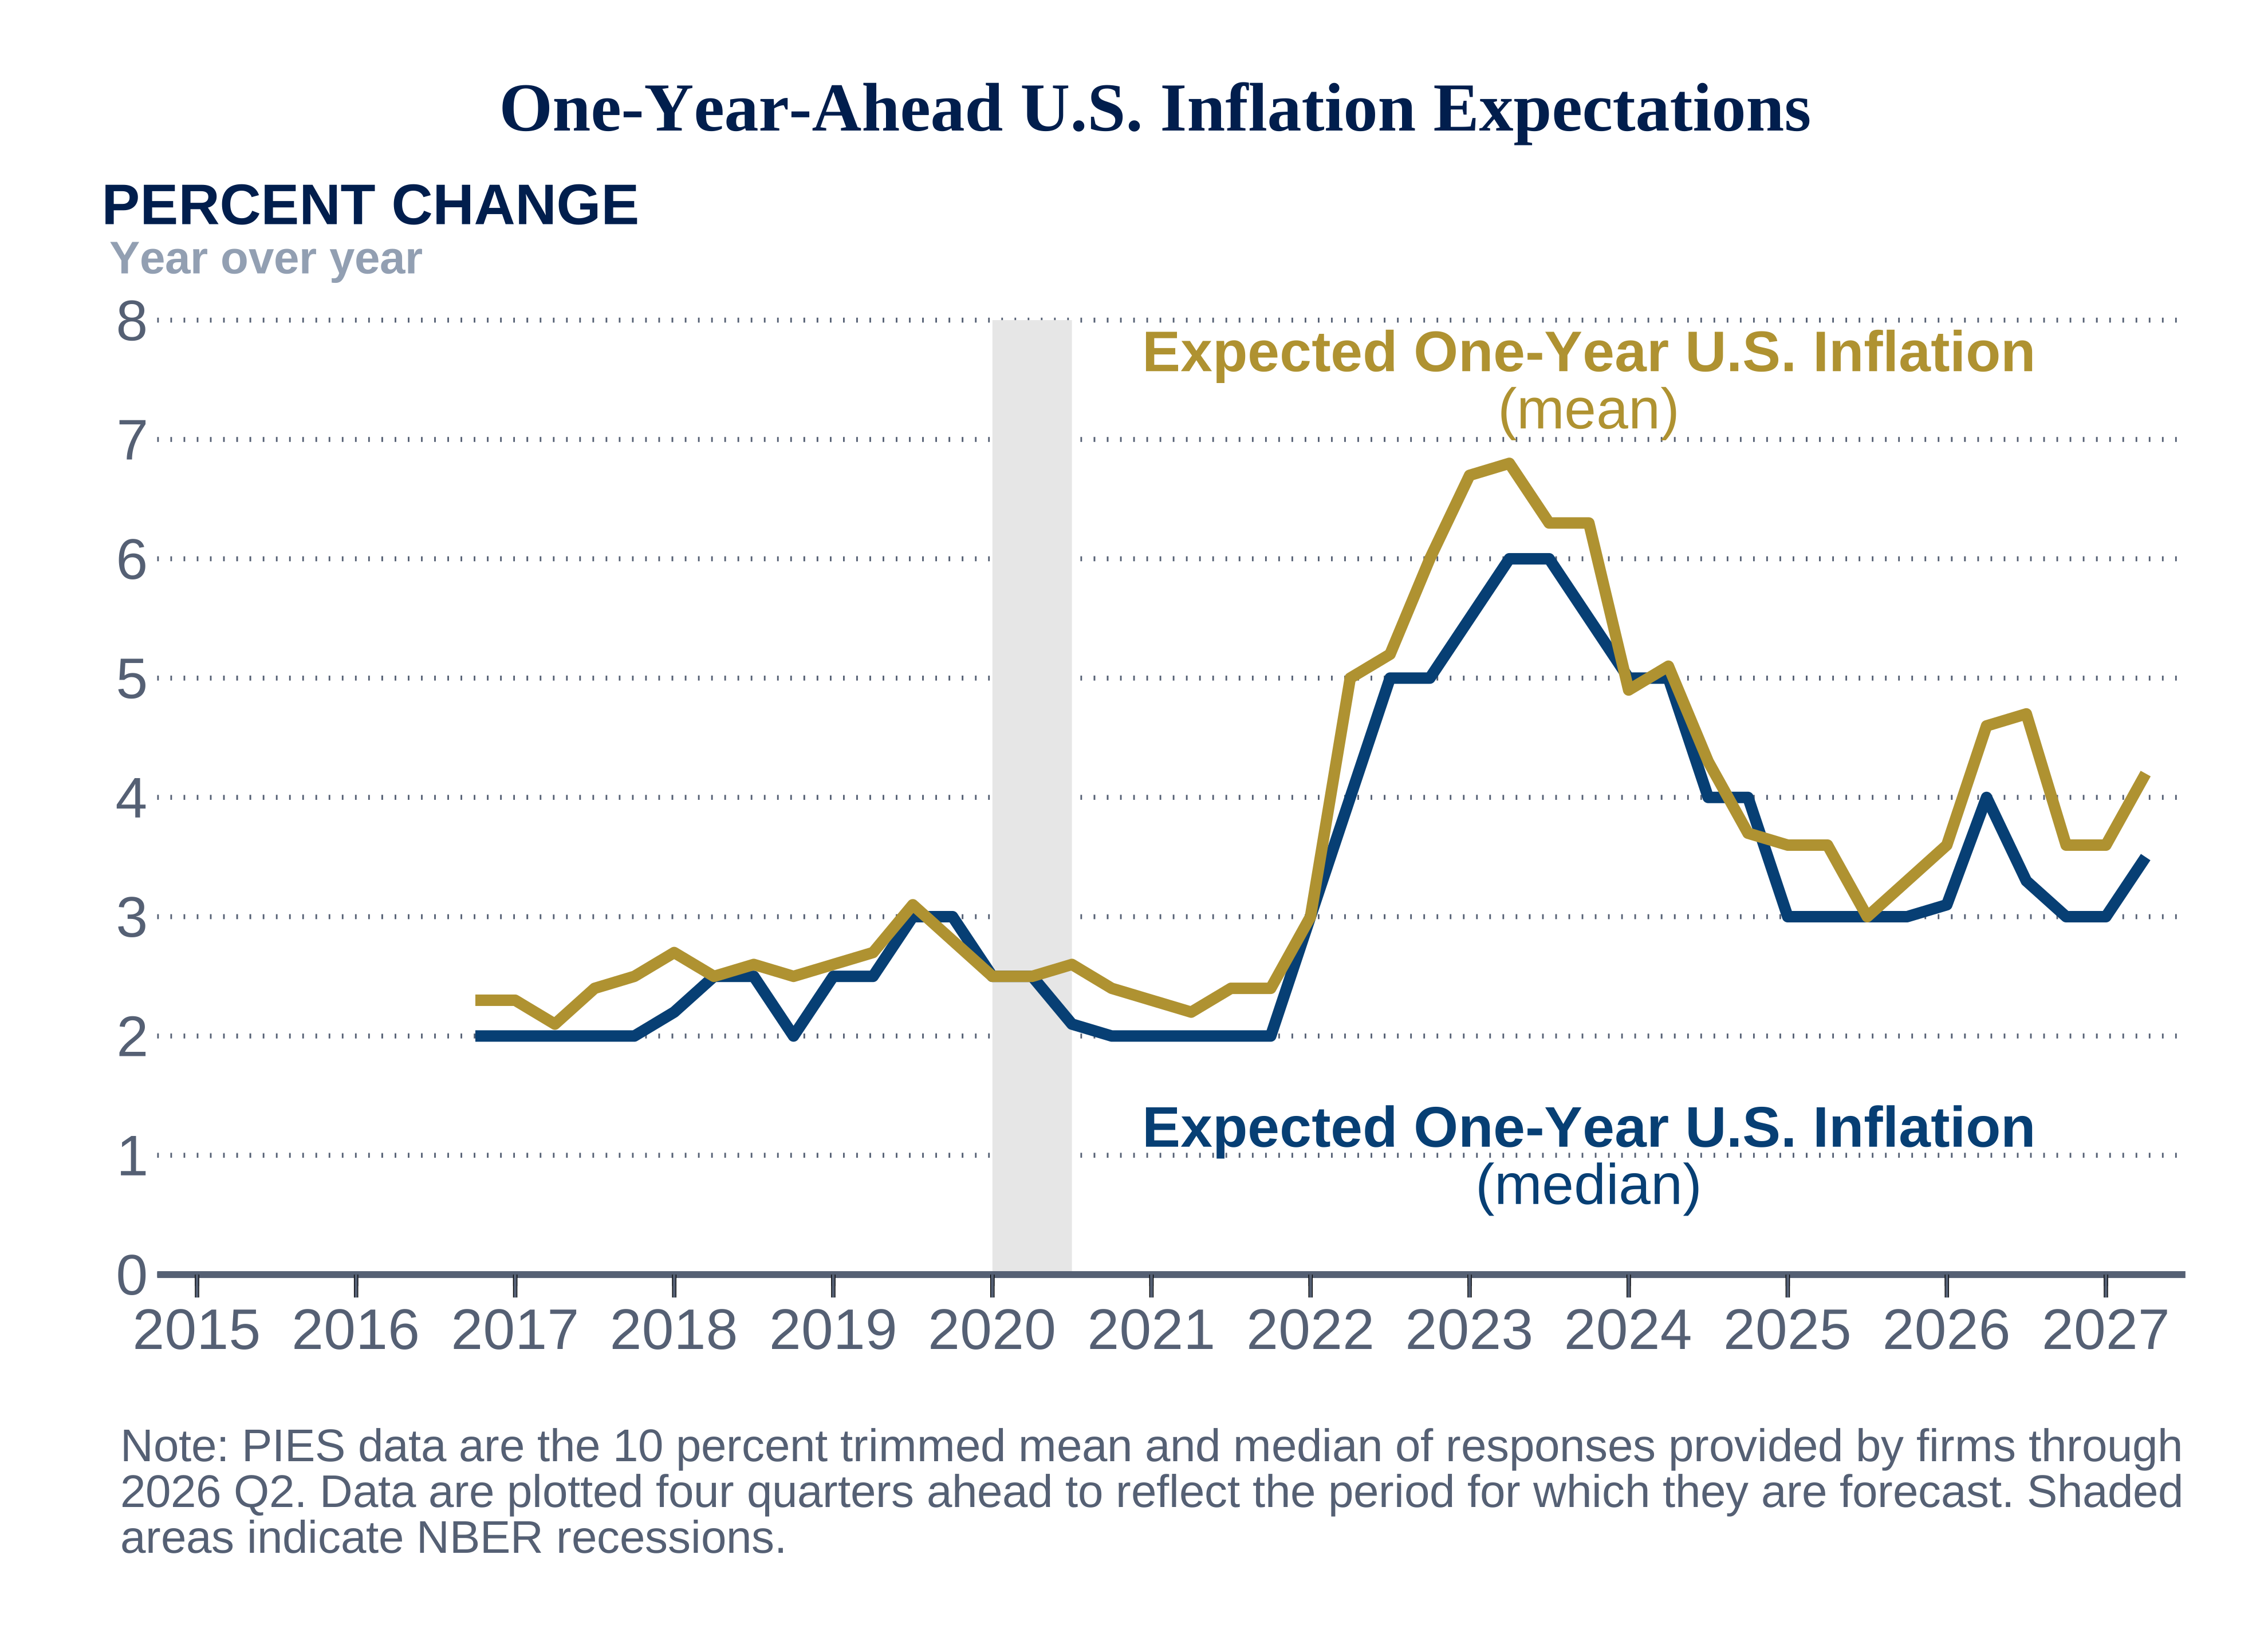
Firms’ U.S. Inflation Expectations Rise Relative to Last Quarter
Firms median expectation for U.S. inflation moved up to 3.5 percent after holding steady at 3.0 percent for two consecutive quarters. The mean expectation was 4.2 percent, up from 3.6 percent last quarter.
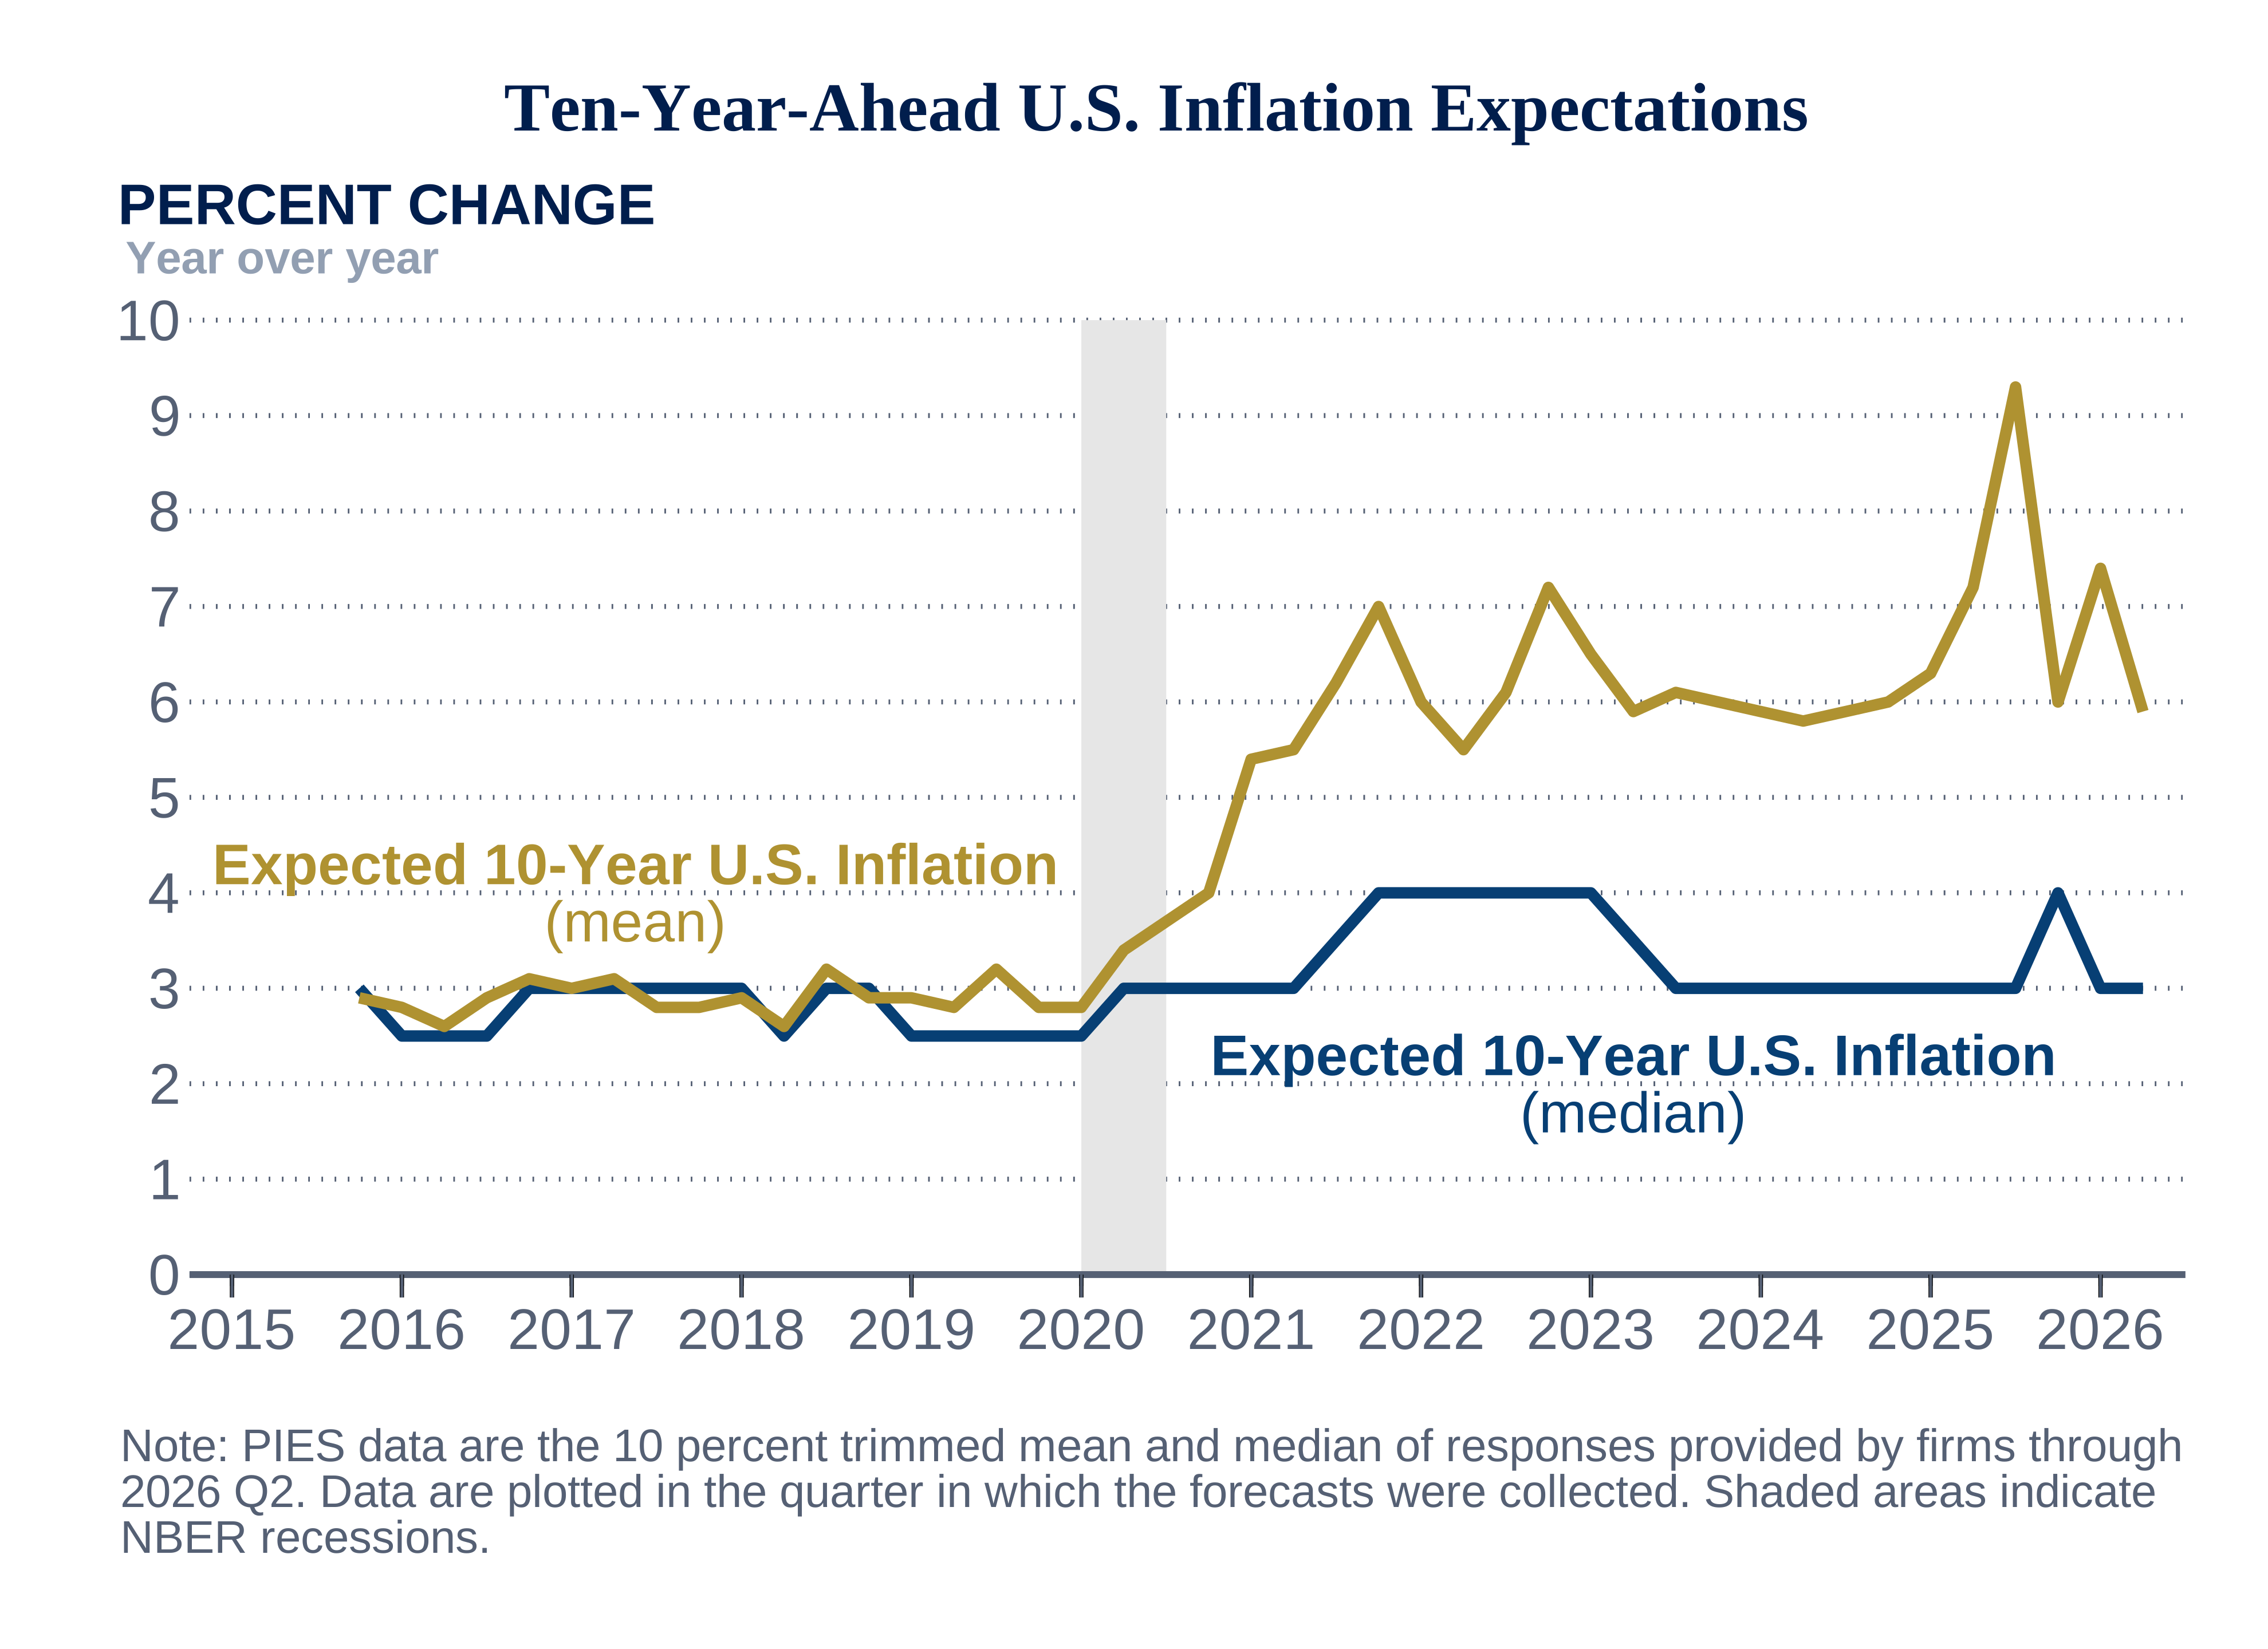
Long-Term Median Inflation Expectations Hold Steady
For the longer run, firms’ median expectations of the average annual price increase that U.S. consumers will experience over the next 10 years held steady from last quarter at 3.0 percent. The mean expectation fell to 5.9 percent from 7.4 percent, after rising last quarter.
Price and Inflation Expectations Survey
| Firm Type | Current 2026 Q2 (%) | Previous 2026 Q1 (%) | |
|---|---|---|---|
|
Reported Change in Own Firm Prices Prices the respondent's firm received (for its own goods and services sold) over the past four quarters |
All | 3.1 | 2.8 |
| Manufacturing | 4.5 | 4.0 | |
| Nonmanufacturing | 2.0 | 2.0 | |
|
Expected Change in Own Firm Prices Prices the respondent's firm will receive (for its own goods and services sold) over the next four quarters |
All | 2.8 | 3.1 |
| Manufacturing | 3.4 | 3.7 | |
| Nonmanufacturing | 2.3 | 2.5 | |
|
Expected Change in Own Compensation Compensation the respondent's firm will pay per employee (for wages and benefits) over the next four quarters |
All | 3.4 | 3.2 |
| Manufacturing | 3.6 | 3.7 | |
| Nonmanufacturing | 3.2 | 2.8 | |
|
Expected U.S. Inflation Prices U.S. consumers will pay for goods and services over the next four quarters |
All (median) | 3.5 | 3.0 |
| All | 4.2 | 3.6 | |
| Manufacturing | 4.0 | 3.8 | |
| Nonmanufacturing | 4.4 | 3.5 | |
|
Expected Long-Run U.S. Inflation Prices U.S. consumers will pay for goods and services over the next 10 years (2026-2035) |
All (median) | 3.0 | 3.0 |
| All | 5.9 | 7.4 | |
| Manufacturing | 6.1 | 6.2 | |
| Nonmanufacturing | 5.8 | 8.3 | |
| Notes: Results reflect data received through May 21, 2026. The numbers in the table represent the trimmed means of individual firm forecasts (percent changes) unless noted otherwise. For Long-Run U.S. Inflation forecasts, firms provided a 10-year annual-average change. The previous quarter's results reflect forecasts made in 2026 Q1 for 2027 Q1. | |||
To see how reported and expected firm prices compare with U.S. CPI over time, see the PIES data explorer.
For more information on how PIES data compare with U.S. CPI as well as with other inflation forecasts, see Introducing PIES.