Manufacturing Business Outlook Survey
October 2026 Report
Jump to
Summary of ReturnsView a PDF version of this report | View a TXT version of this report
Manufacturing activity in the region continued to expand overall, according to the firms responding to the October Manufacturing Business Outlook Survey. The survey’s indicators for general activity, new orders, and shipments all declined but remained positive this month. The employment index edged down but continued to suggest overall increases in employment. The prices paid index moved down, while the prices received index moved higher this month; both continued to indicate overall increases in prices. The firms continued to expect overall growth over the next six months, but most future indicators declined.
Current Indexes Fall but Remain Positive
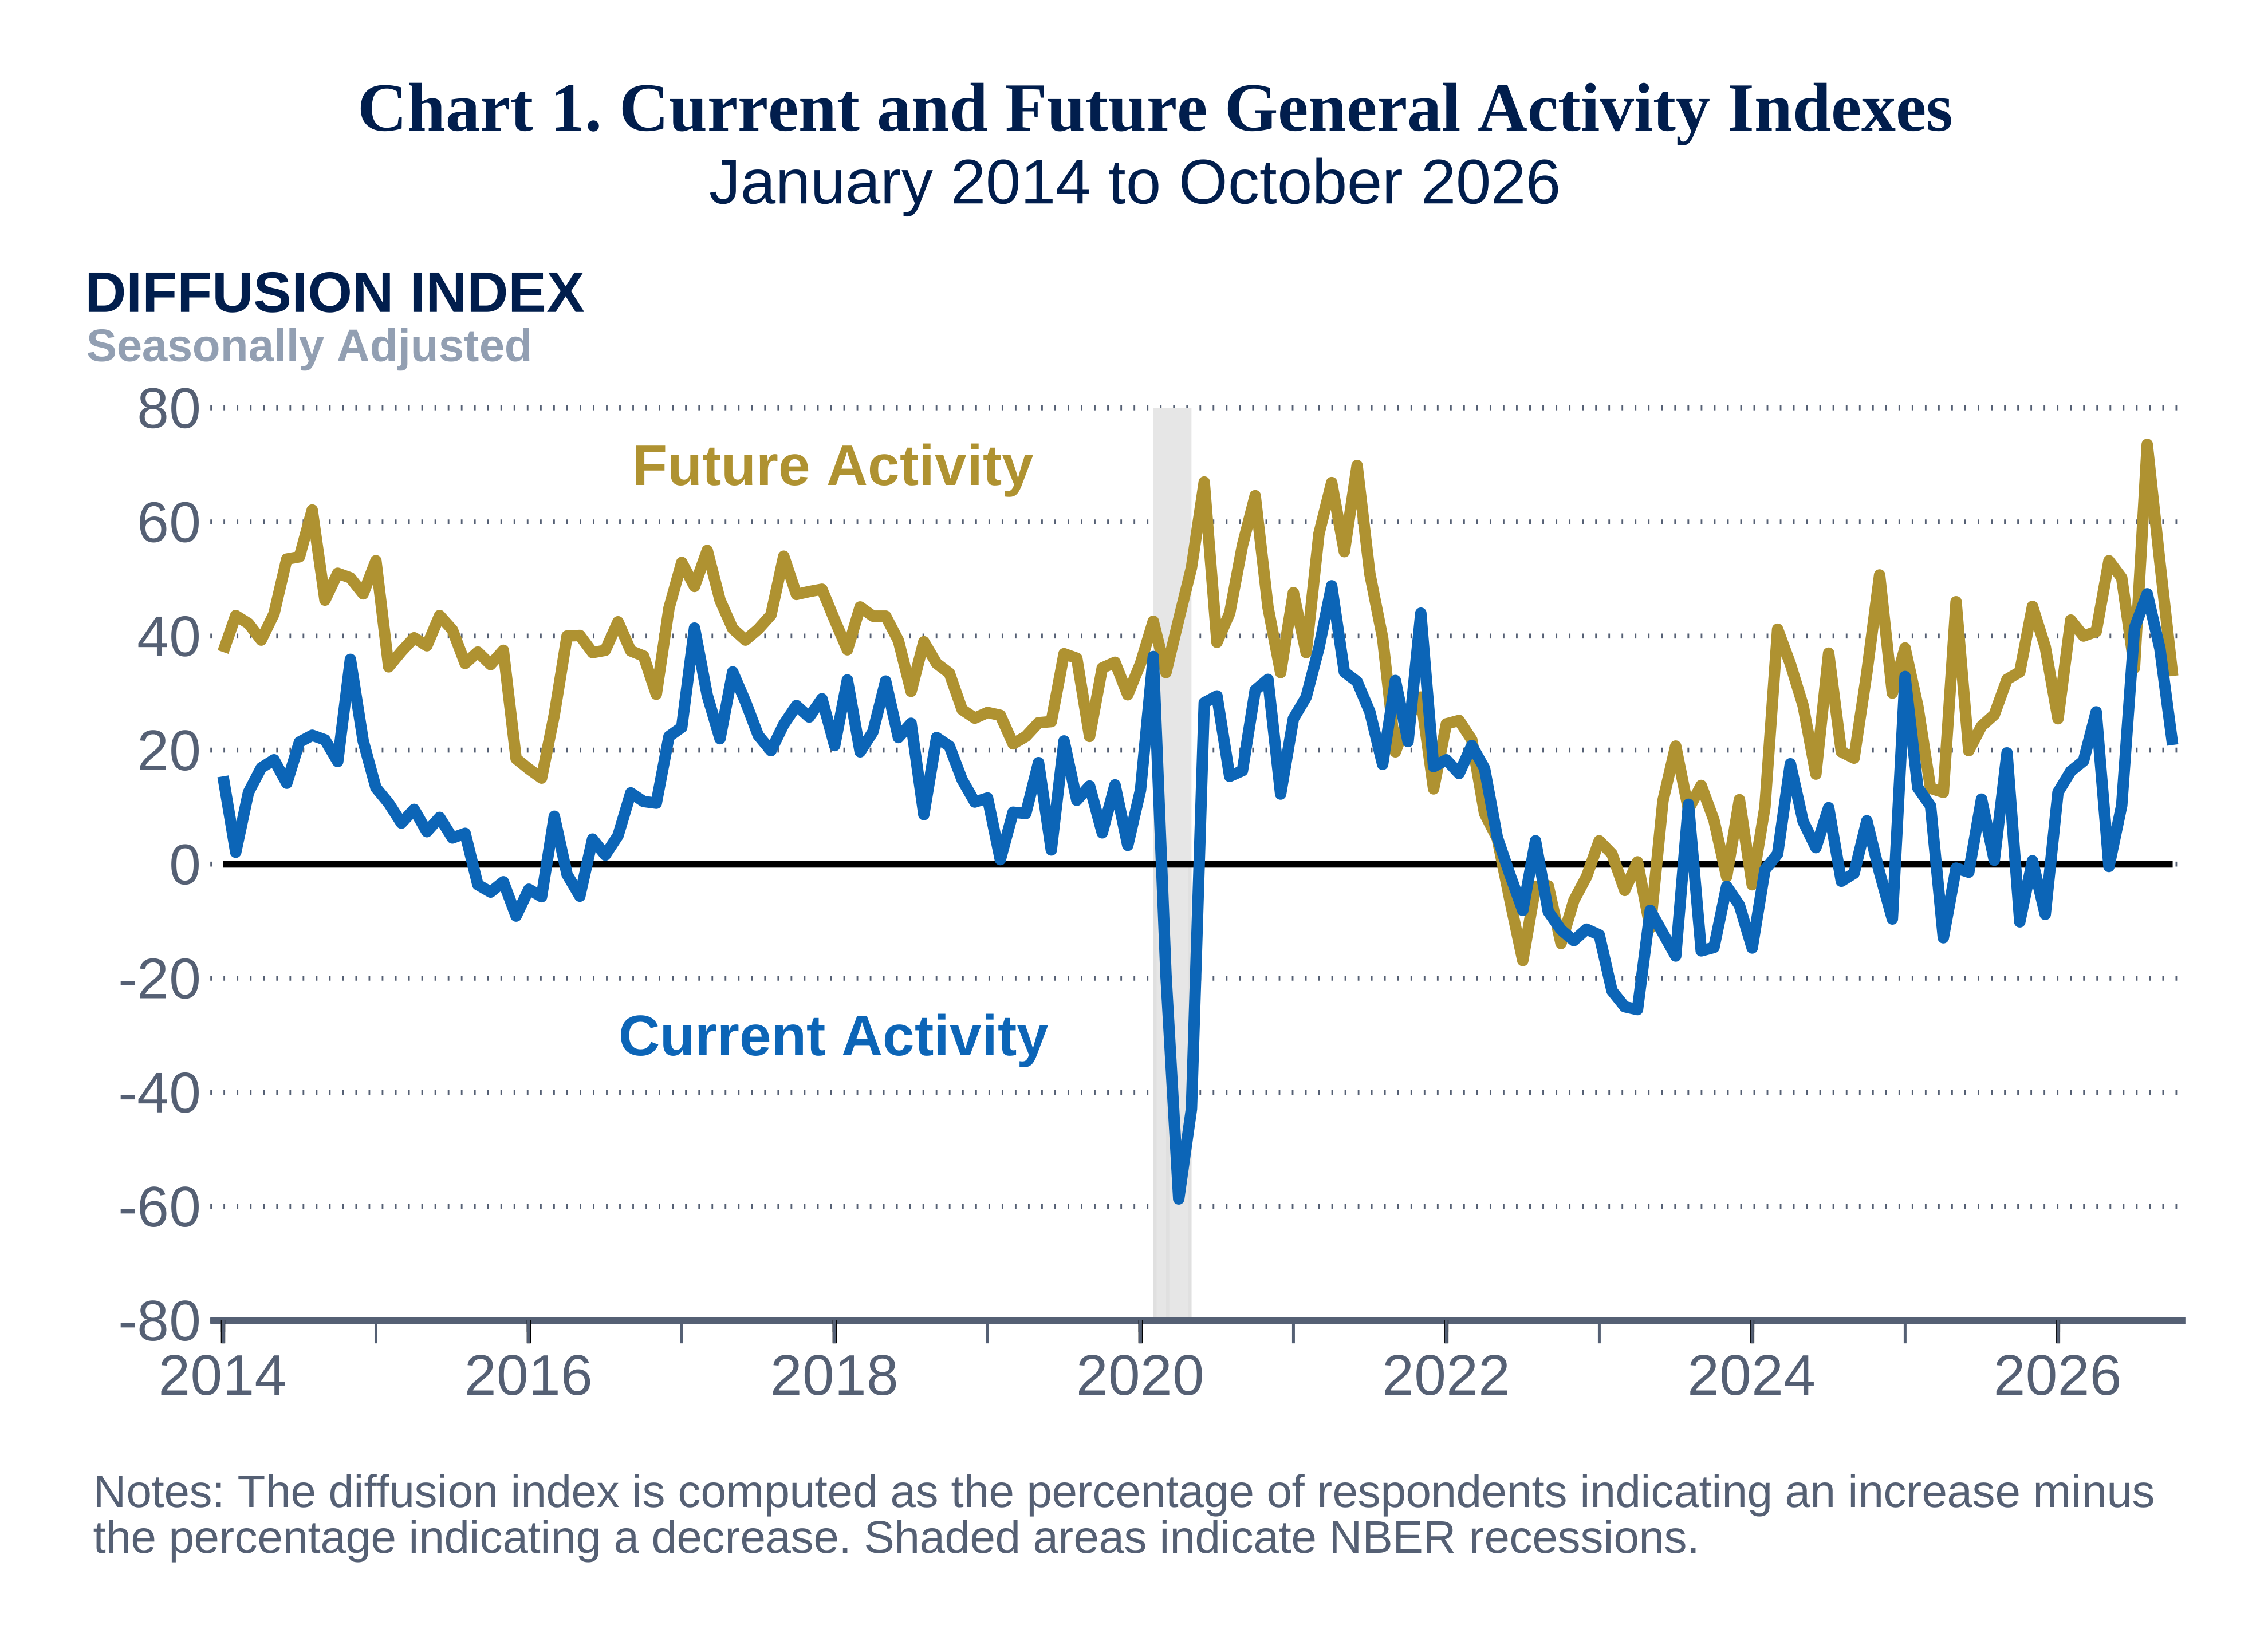
The diffusion index for current general activity declined for the second consecutive month, falling from 37.8 in September to 20.9 in October (see Chart 1). More than 41 percent of the firms reported increases in activity (down from 45 percent last month), and 20 percent reported decreases (up from 8 percent); 27 percent of the firms reported no change in current activity (down from 45 percent). The new orders index fell 25 points to 4.3 this month. Almost 39 percent of the firms reported increases in new orders, 34 percent reported decreases, and 22 percent reported no change. The current shipments index moved down 12 points to 15.3.
The employment index continued to indicate an increase in employment overall but edged down 3 points to 9.1 in October. Eighteen percent of the firms reported increases, 9 percent reported decreases, and 68 percent reported no change in employment. The average workweek index declined 11 points to 7.5, its lowest reading since June.
Price Indexes Remain Elevated
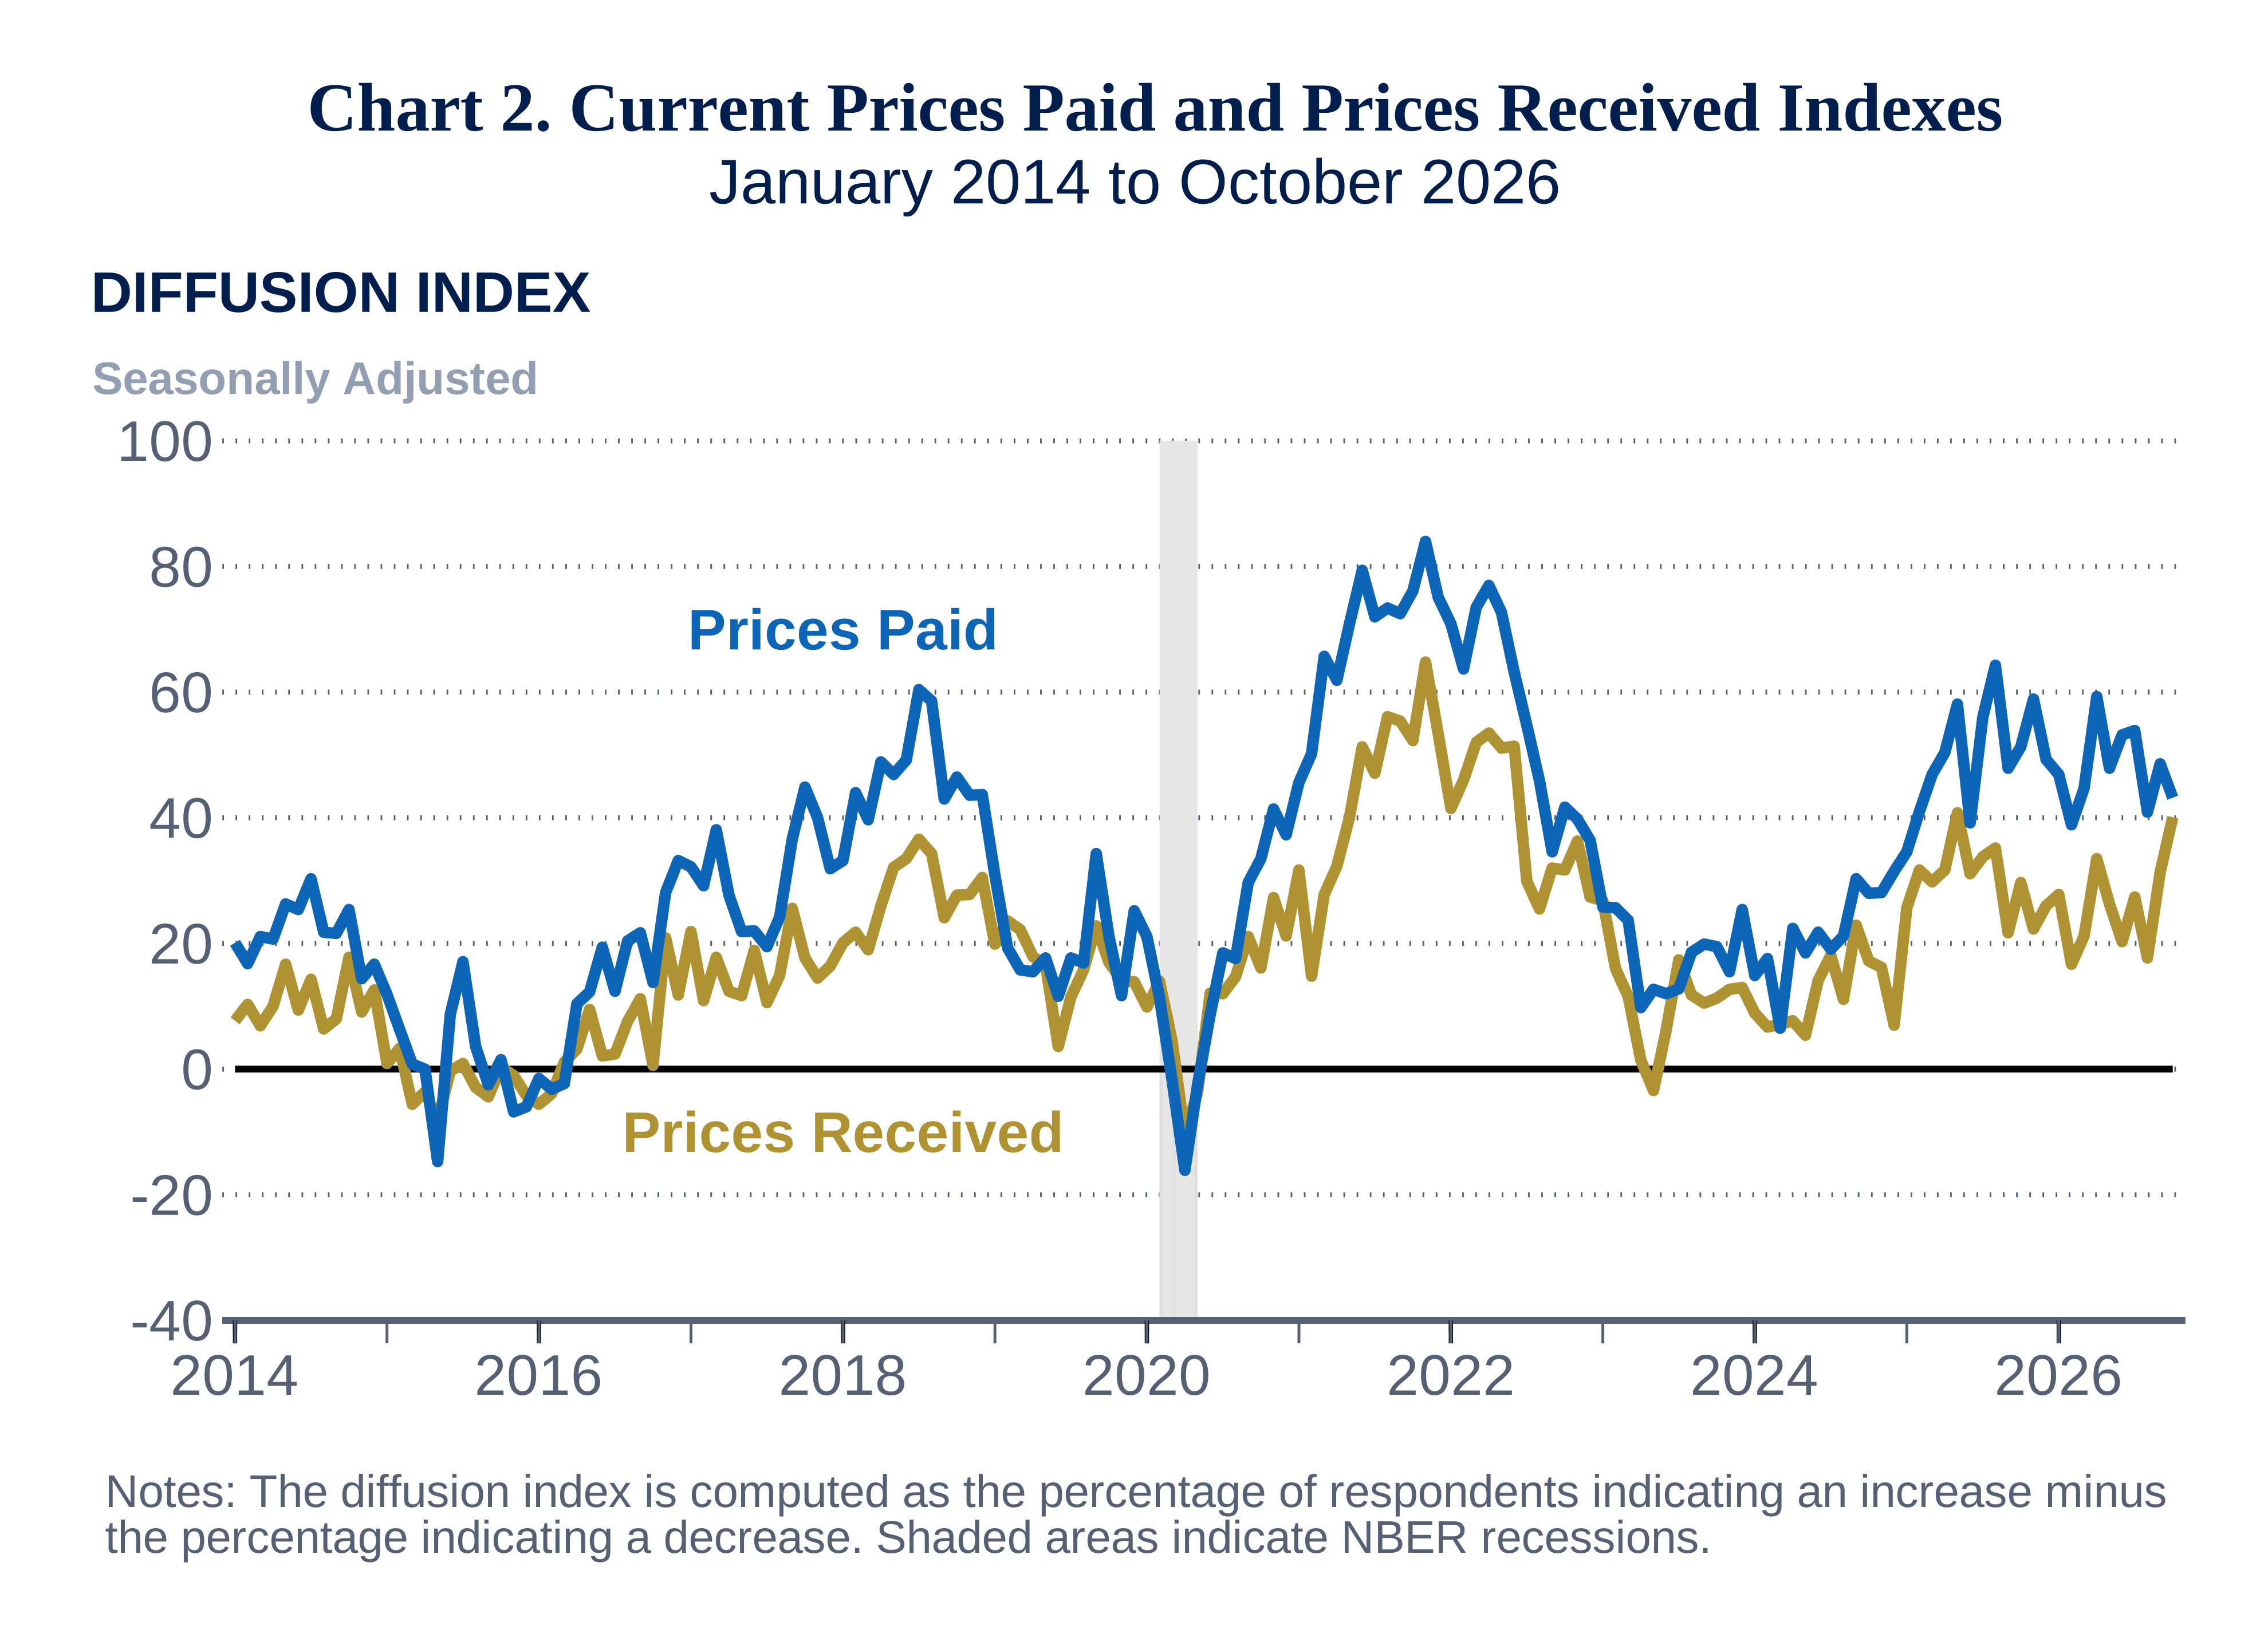
The firms continued to report overall increases in prices. The prices paid index moved down 5 points to 43.2 in October (see Chart 2). More than 43 percent of the firms reported increases in input prices, 52 percent reported no change, and no firms reported decreases. The current prices received index rose 9 points to 40.1, its highest reading since May 2025. More than 41 percent of the firms reported increases in the prices of their own goods (up from 33 percent last month), 52 percent reported no change (down from 66 percent), and 1 percent of the firms reported decreases (unchanged from last month).
Firms Anticipate Higher Capital Expenditures Next Year
In this month’s special question, manufacturers were asked about their plans for different categories of capital expenditures next year. More than 52 percent of the firms expect higher total capital spending, and no firm expects lower capital spending next year; 48 percent of the firms expect total spending to stay the same. When this question was asked last year, 36 percent expected to increase spending, and 19 percent expected to decrease spending. Expectations for higher capital expenditures were most widespread for noncomputer equipment, software, and computer and related hardware. However, at least half of the firms expect capital expenditures to stay the same across all categories.
Firms Continue to Expect Growth
The diffusion index for future general activity fell 20 points to 33.0 this month, its second consecutive decline and lowest reading since January (see Chart 1). More than 51 percent of the firms expect an increase in activity over the next six months, 18 percent expect a decrease, and 18 percent expect no change. The future new orders index fell 25 points to 37.0, and the future shipments index fell 26 points to 35.2. The firms continue to expect increases in employment over the next six months, although the future employment index more than offset its increase from last month, falling 21 points to 30.1. Both future price indexes also decreased this month but remained well above their respective long-run averages. The future prices paid index fell 8 points to 62.9, while the future prices received index fell 10 points to 62.1. The index for future capital expenditures edged down 2 points to 34.9 this month.
Summary
Responses to the October Manufacturing Business Outlook Survey suggest overall expansion in the region’s manufacturing activity. The indicators for current activity, new orders, and shipments all moderated but remained positive this month. The firms continued to indicate overall increases in prices. The survey’s broad indicators for future activity continued to suggest expectations for growth over the next six months, although those expectations were less widespread this month.
Special Question (October 2026)
| Comparing 2027 with 2026, do you expect capital expenditures to be higher, the same, or lower for each of the following categories? | ||||
|---|---|---|---|---|
|
Higher (% of reporters) |
Same (% of reporters) |
Lower (% of reporters) |
Diffusion Index |
|
| Software | 39.1 | 52.2 | 8.7 | 30.4 |
| Noncomputer equipment | 50.0 | 50.0 | 0.0 | 50.0 |
| Energy-saving investments | 27.3 | 59.1 | 13.6 | 13.6 |
| Computer and related hardware | 39.1 | 52.2 | 8.7 | 30.4 |
| Structure | 34.8 | 56.5 | 8.7 | 26.1 |
| Other | 0.0 | 100.0 | 0.0 | 0.0 |
| Total capital spending | 52.2 | 47.8 | 0.0 | 52.2 |
MBOS Summary of Returns – October 2026
| October vs. September |
Six Months from Now vs. October |
|||||||||||
|---|---|---|---|---|---|---|---|---|---|---|---|---|
|
Prev. Diff. Index |
Inc. | No ch. | Dec. |
Diff. Index |
Prev. Diff. Index |
Inc. | No ch. | Dec. | Diff. Index |
|||
| General Business Activity | 37.8 | 41.2 | 27.2 | 20.3 | 20.9 | 52.9 | 51.4 | 18.3 | 18.4 | 33.0 | ||
| New Orders | 29.2 | 38.5 | 21.7 | 34.1 | 4.3 | 62.3 | 50.4 | 29.0 | 13.4 | 37.0 | ||
| Shipments | 27.7 | 35.9 | 38.3 | 20.6 | 15.3 | 61.1 | 48.7 | 25.4 | 13.5 | 35.2 | ||
| Unfilled Orders | 20.4 | 16.4 | 63.6 | 14.1 | 2.4 | 16.8 | 21.0 | 43.4 | 22.7 | -1.6 | ||
| Delivery Times | 26.5 | 16.6 | 70.9 | 8.1 | 8.5 | 18.6 | 15.7 | 53.0 | 23.2 | -7.5 | ||
| Inventories | -12.5 | 10.9 | 57.3 | 23.7 | -12.8 | 11.6 | 29.4 | 49.9 | 6.0 | 23.4 | ||
| Prices Paid | 48.6 | 43.2 | 51.5 | 0.0 | 43.2 | 71.3 | 67.7 | 17.3 | 4.8 | 62.9 | ||
| Prices Received | 31.3 | 41.1 | 52.2 | 1.0 | 40.1 | 72.3 | 65.2 | 17.5 | 3.1 | 62.1 | ||
| Number of Employees | 11.8 | 18.0 | 67.6 | 8.8 | 9.1 | 50.6 | 30.1 | 61.2 | 0.0 | 30.1 | ||
| Average Employee Workweek | 18.0 | 14.7 | 71.5 | 7.2 | 7.5 | 31.8 | 20.0 | 59.2 | 9.9 | 10.1 | ||
| Capital Expenditures | -- | -- | -- | -- | -- | 37.1 | 34.9 | 61.9 | 0.0 | 34.9 | ||
| Notes: (1) Diffusion indexes represent the percentage of respondents indicating an increase minus the percentage indicating a decrease. (2) All data are seasonally adjusted. (3) Percentages may not sum to 100 because of rounding, omission by respondents, or both. (4) Survey results reflect data received through October 12, 2026. Federal Reserve Bank of Philadelphia Manufacturing Business Outlook Survey Released: October 15, 2026, at 8:30 a.m. ET. |
||||||||||||