Manufacturing Business Outlook Survey
September 2026 Report
Note: Survey responses were collected from September 7 to September 15.
Jump to
Summary of ReturnsView a PDF version of this report | View a TXT version of this report
Manufacturing activity in the region expanded overall, according to the firms responding to the September Manufacturing Business Outlook Survey. The survey’s indicators for general activity, new orders, and shipments all remained elevated this month. The employment index fell but remained positive, continuing to suggest overall increases in employment. Both price indicators moved higher this month after declining last month. The firms continued to expect overall growth over the next six months.
Current Indexes Remain Positive
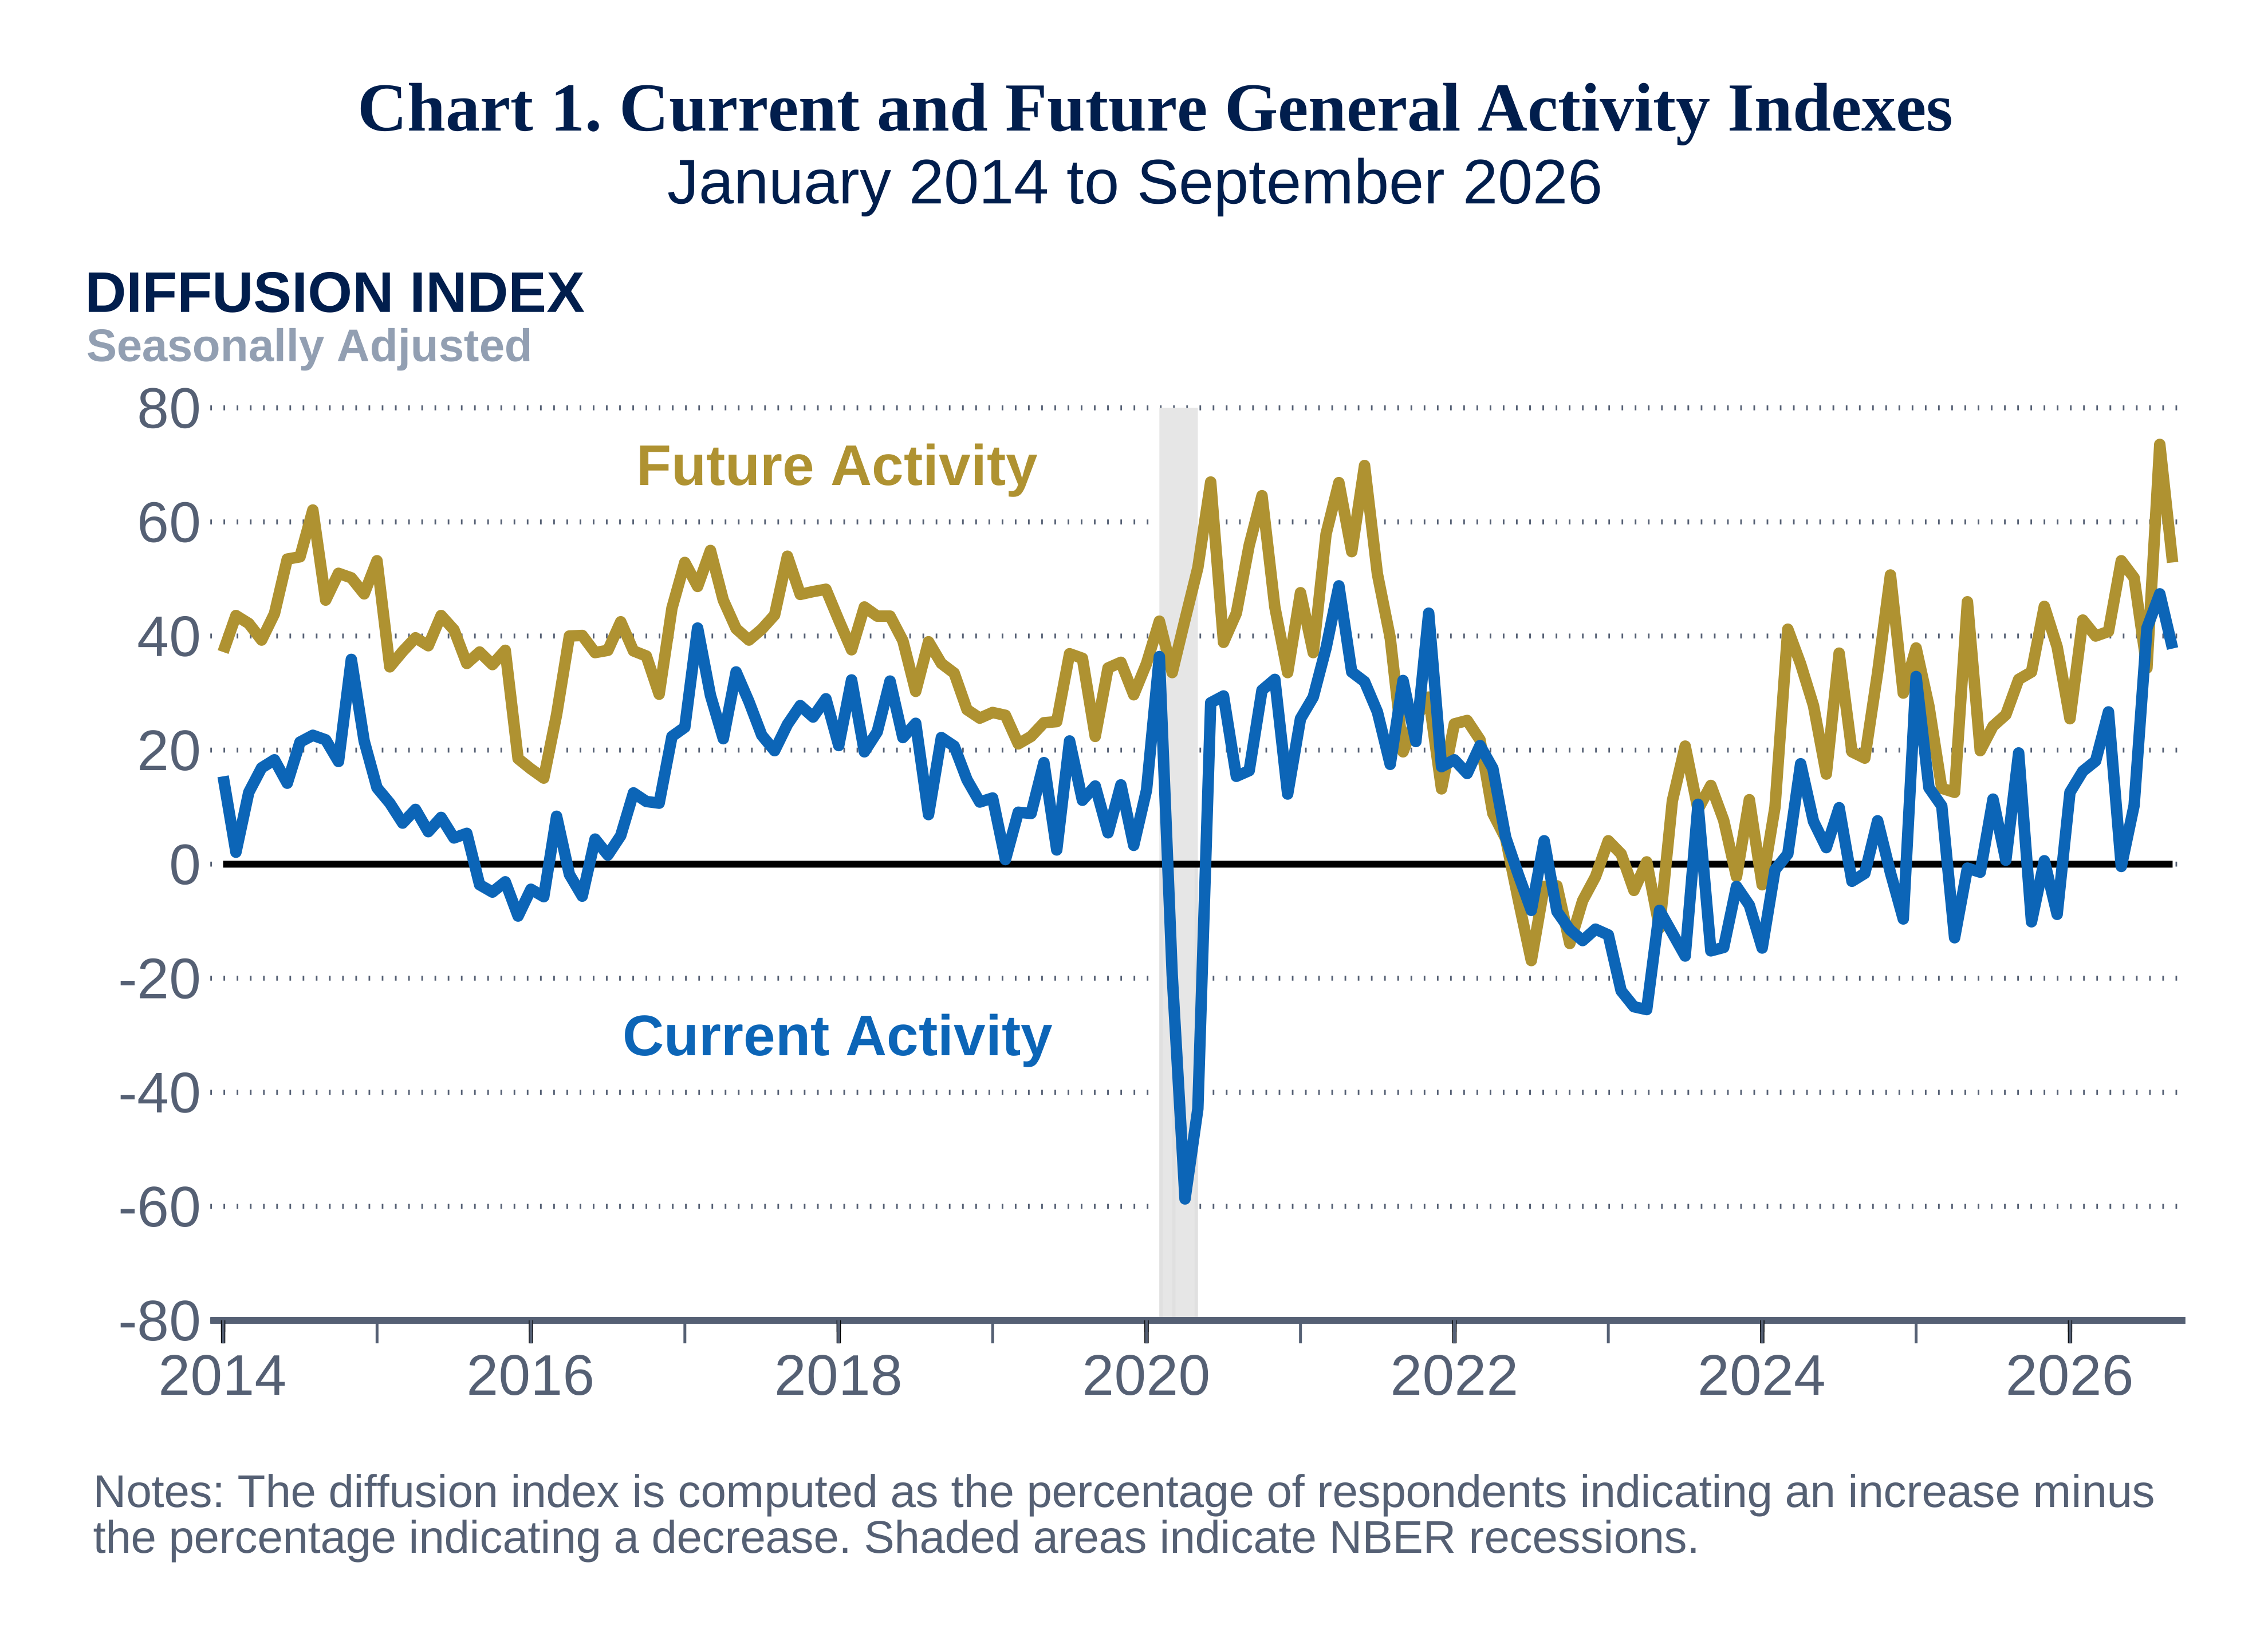
The diffusion index for current general activity fell from 47.4 in August to 37.8 in September (see Chart 1). Equal shares of the firms (45 percent) reported either increases or no change in current activity, and 8 percent reported decreases. The new orders index edged down 1 point to 29.2 this month. Over 44 percent of the firms reported increases in new orders, 15 percent reported decreases, and 40 percent reported no change. The current shipments index remained unchanged at 27.7.
The firms reported an increase in employment overall; however, the employment index fell 16 points to 11.8 in September, mostly undoing its increase from last month. More than 17 percent of the firms reported increases (down from 33 percent last month), 6 percent reported decreases (up from 5 percent), and most firms (77 percent) reported no change in employment (up from 62 percent). The average workweek index declined to 18.0, marking its third consecutive month of elevated readings.
Price Indexes Remain Elevated
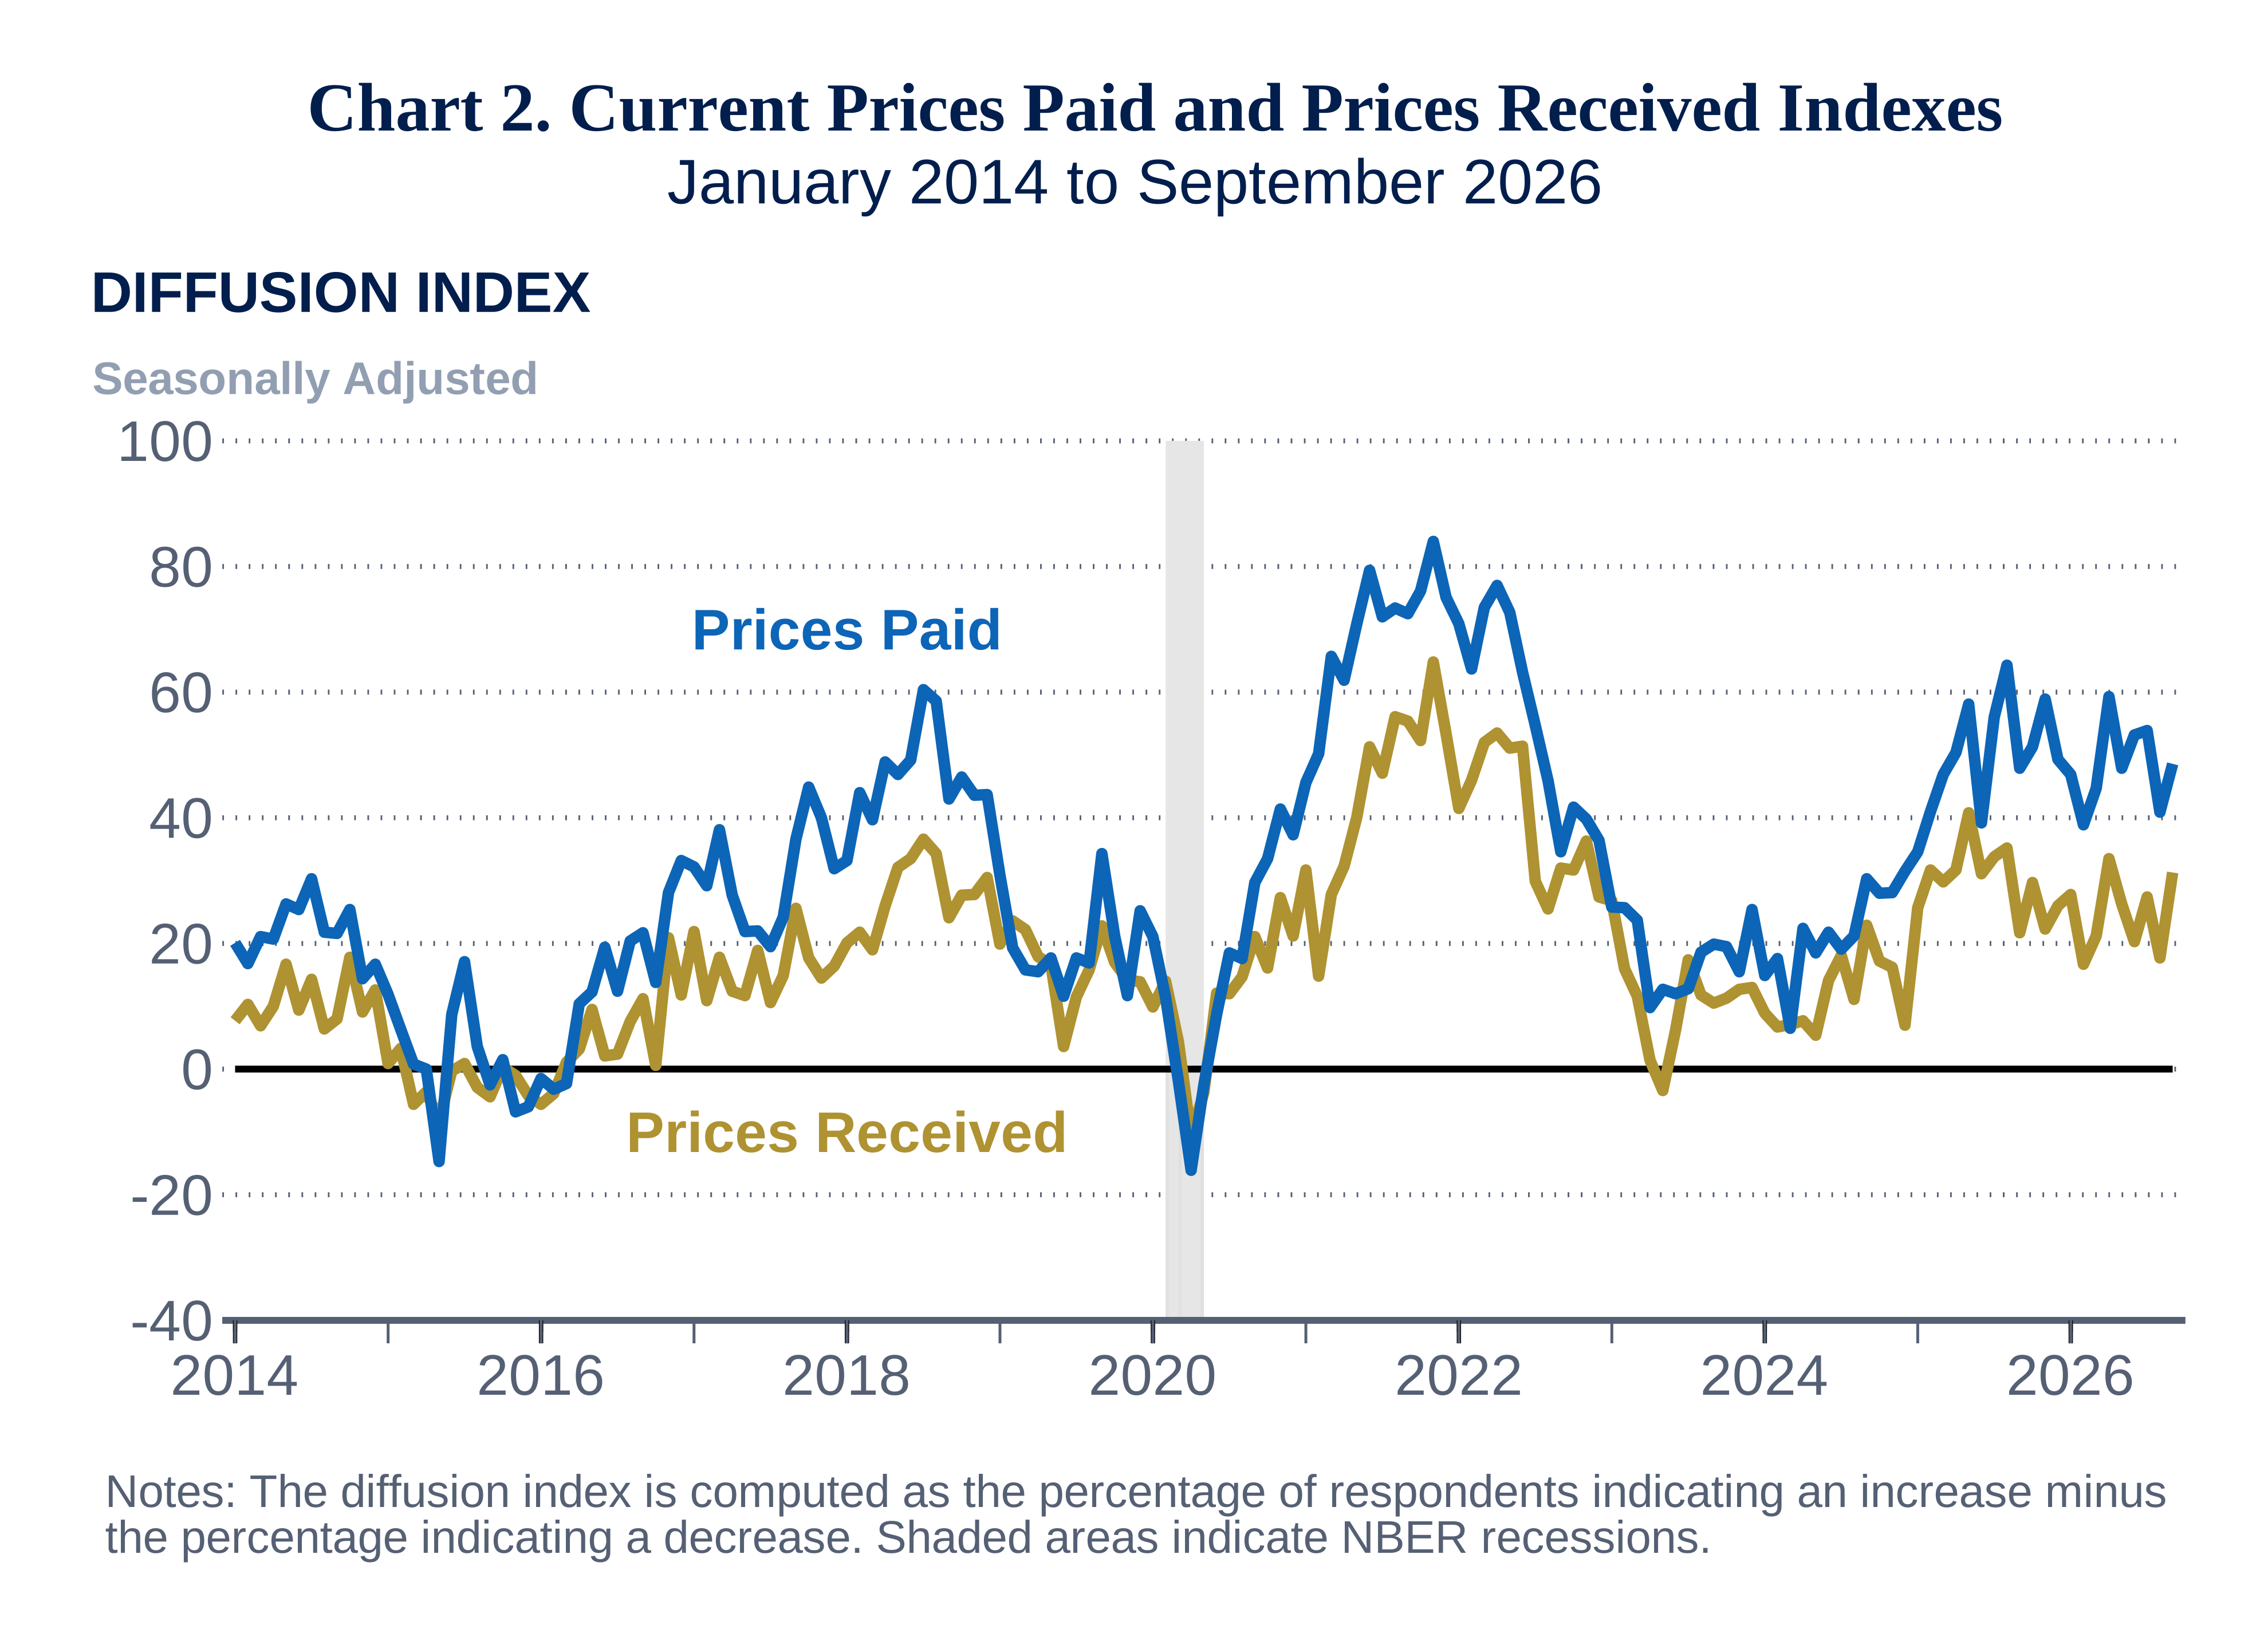
The firms continued to report overall increases in prices. The prices paid index rose 8 points to 48.6 in September, after falling 13 points last month (see Chart 2). Almost 51 percent of the firms reported increases in input prices (up from 41 percent), 46 percent reported no change (down from 59 percent), and 2 percent reported decreases (up from no firms). The current prices received index rose 14 points to 31.3, its highest reading since April. Nearly 33 percent of the firms reported increases in the prices of their own goods (up from 21 percent), 66 percent reported no change (down from 74 percent), and 1 percent of the firms reported decreases (down from 3 percent).
Firms Report Higher Production, Little Change in Capacity Utilization This Quarter
In this month’s special questions, the firms were asked to estimate their total production growth for the third quarter ending this month compared with the second quarter of 2026. A higher share of the firms reported an increase in production (68 percent) than reported a decrease (16 percent). Regarding the firms’ capacity utilization for the current quarter and one year ago, the median current capacity utilization rate reported among the responding firms was unchanged at 70 to 80 percent.
Seventy-two percent of the firms reported that labor supply was at least a slight constraint to capacity utilization in the current quarter, up from 50 percent when the question was last asked in June. Looking ahead over the next three months, most of the firms expect the impacts of various factors to stay the same. However, 36 percent of the firms expect the impact of energy markets to worsen over the next three months (similar to last quarter), and 20 percent expect the impact of uncertainty to worsen (down from 44 percent last quarter).
Firms Continue to Expect Growth
The diffusion index for future general activity fell 21 points to 52.9 this month, its lowest reading since July (see Chart 1). Almost 58 percent of the firms expect an increase in activity over the next six months, 5 percent expect a decrease, and 33 percent expect no change. The future new orders index moved down 4 points to 62.3, and the future shipments index edged down 2 points to 61.1. The firms continue to expect increases in employment over the next six months, and the future employment index moved higher to 50.6. Both future price indexes also rose further this month and remained well above their respective long-run averages. The future prices paid index rose from 62.9 to 71.3, while the future prices received index rose 13 points to 72.3. The index for future capital expenditures remained elevated but fell 11 points to 37.1.
Summary
Responses to the September Manufacturing Business Outlook Survey suggest overall expansion in the region’s manufacturing activity. The indicators for current activity, new orders, and shipments remained elevated. The firms continued to indicate overall increases in prices, and both indexes moved higher. The survey’s broad indicators for future activity continued to suggest expectations for growth over the next six months.
Special Questions (September 2026)
| An increase of: | % of firms | Subtotals |
|---|---|---|
| 10% or more | 12.0 | % of firms reporting an increase: 68.0 |
| 5-10% | 24.0 | |
| 0-5% | 32.0 | |
| No change | 16.0 | |
| A decline of: | ||
| 0-5% | 4.0 | % of firms reporting a decrease: 16.0 |
| 5-10% | 4.0 | |
| 10% or more | 8.0 |
Capacity Utilization Rate |
2026:Q3 % of Reporters |
2025:Q3 % of Reporters |
|---|---|---|
| Less than 30% | 0.0 | 0.0 |
| 30-40% | 0.0 | 0.0 |
| 40-50% | 0.0 | 4.0 |
| 50-60% | 12.5 | 16.0 |
| 60-70% | 20.8 | 20.0 |
| 70-80% | 37.5 | 40.0 |
| 80-90% | 12.5 | 8.0 |
| 90-100% | 16.7 | 12.0 |
| Median Utilization Rate | 70-80 | 70-80 |
|
Not at all (%) |
Slightly (%) |
Moderately (%) |
Significantly (%) |
|
|---|---|---|---|---|
| Energy markets | 76.0 | 4.0 | 8.0 | 12.0 |
| Financial capital | 84.0 | 4.0 | 12.0 | 0.0 |
| Labor supply | 28.0 | 28.0 | 32.0 | 12.0 |
| Supply chains | 40.0 | 28.0 | 28.0 | 4.0 |
| Uncertainty | 32.0 | 36.0 | 28.0 | 4.0 |
| Other factors | 70.6 | 0.0 | 11.8 | 17.6 |
|
Worsen (%) |
Stay the same (%) |
Improve (%) |
|
|---|---|---|---|
| Energy markets | 36.0 | 60.0 | 4.0 |
| Financial capital | 12.0 | 88.0 | 0.0 |
| Labor supply | 16.0 | 76.0 | 8.0 |
| Supply chains | 16.0 | 80.0 | 4.0 |
| Uncertainty | 20.0 | 64.0 | 16.0 |
| Other factors | 0.0 | 100.0 | 0.0 |
MBOS Summary of Returns – September 2026
| September vs. August |
Six Months from Now vs. September |
|||||||||||
|---|---|---|---|---|---|---|---|---|---|---|---|---|
|
Prev. Diff. Index |
Inc. | No ch. | Dec. |
Diff. Index |
Prev. Diff. Index |
Inc. | No ch. | Dec. | Diff. Index |
|||
| General Business Activity | 47.4 | 45.3 | 45.1 | 7.5 | 37.8 | 73.6 | 57.9 | 33.0 | 5.0 | 52.9 | ||
| New Orders | 30.1 | 44.2 | 40.0 | 15.0 | 29.2 | 66.0 | 64.7 | 32.3 | 2.4 | 62.3 | ||
| Shipments | 27.7 | 42.3 | 43.2 | 14.5 | 27.7 | 63.5 | 66.2 | 28.8 | 5.1 | 61.1 | ||
| Unfilled Orders | 14.4 | 31.6 | 55.6 | 11.2 | 20.4 | 8.5 | 22.8 | 68.9 | 6.0 | 16.8 | ||
| Delivery Times | 3.7 | 26.5 | 72.7 | 0.0 | 26.5 | 0.0 | 25.9 | 65.1 | 7.3 | 18.6 | ||
| Inventories | -3.7 | 7.4 | 72.8 | 19.8 | -12.5 | 17.4 | 22.6 | 66.3 | 11.0 | 11.6 | ||
| Prices Paid | 40.9 | 50.5 | 45.9 | 1.9 | 48.6 | 62.9 | 80.1 | 9.7 | 8.8 | 71.3 | ||
| Prices Received | 17.7 | 32.6 | 66.1 | 1.3 | 31.3 | 59.8 | 80.0 | 12.2 | 7.7 | 72.3 | ||
| Number of Employees | 27.9 | 17.3 | 77.1 | 5.5 | 11.8 | 35.4 | 50.7 | 47.0 | 0.2 | 50.6 | ||
| Average Employee Workweek | 26.5 | 21.9 | 69.8 | 3.9 | 18.0 | 21.4 | 34.1 | 60.8 | 2.3 | 31.8 | ||
| Capital Expenditures | -- | -- | -- | -- | -- | 48.2 | 42.3 | 52.3 | 5.2 | 37.1 | ||
| Notes: (1) Diffusion indexes represent the percentage of respondents indicating an increase minus the percentage indicating a decrease. (2) All data are seasonally adjusted. (3) Percentages may not sum to 100 because of rounding, omission by respondents, or both. (4) Survey results reflect data received through September 15, 2026. Federal Reserve Bank of Philadelphia Manufacturing Business Outlook Survey Released: September 17, 2026, at 8:30 a.m. ET. |
||||||||||||