


Housing prices play a central role in the U.S. economy. They are a major source of household wealth, which in turn drives consumption, and housing construction itself is a major employer. That's why economists use housing prices to measure the cost of living, the distribution of wealth, and access to jobs.
These prices vary markedly over time and by region. For example, during the most recent housing boom from 2019 to 2024, housing price levels in the Miami–Miami Beach–Kendall, FL, metropolitan statistical area division (MSAD) grew twice as fast as in the Philadelphia, PA, MSAD.1 Economists have shown that past housing booms and busts had similar regional variation, although they struggle to fully understand these historical episodes without sufficient historical data. Many data sets, such as the decadal information from the federal census, are too infrequent. Other data sets — such as the housing sales price series for U.S. cities that the Federal Housing Finance Agency (FHFA) launched in 1975 — begin too recently. If economists are to understand how past policy decisions shape today's housing prices, they need more frequent, longer-run, city-level data.
The Philadelphia Fed's recently launched Historical Housing Prices (HHP) Project substantially improves upon the available data by providing housing price series covering 30 cities from 1890 to 2024.2 With the help of these longer-run series, researchers can now acquire new insight into the causes and consequences of today's housing prices.
Figure 1
Source: Special Collections Research Center, Temple
University Libraries
Constructing Housing Price Series for 1890–2024
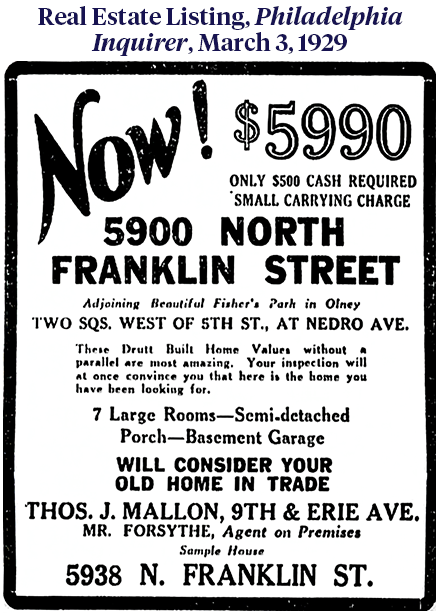
The HHP Project's data come from newspapers, which contain some of the best available systematic information on the price of housing for sale. Other sources, such as old transaction records and tax assessments, are difficult to access. But major newspapers — which, by the late 19th century, contained real estate sections with an array of classified listings — are relatively easy to access. The HHP Project's newspaper sample runs from 1890 to 2006, and its 2.7 million newspaper listings feature each unit's sales price, location, and size (Figure 1).3 Together, these listings allow us to collect data from 30 cities covering most major regions of the United States, from the Sunbelt to the industrial Northeast and Midwest, including Philadelphia.
Using millions of newspaper listings to create a housing price index requires an approach specialized for this type of data. Ideally, a housing price index measures changes in the price of the same housing unit over some reference period. However, the composition of the housing stock changes over the long run. For instance, over the course of the 20th century, houses generally became larger and, by modern standards, nicer, especially with the introduction of central heating and electric refrigerators. These quality improvements complicate the exercise of tracking "constant quality" housing across time.
To address this challenge, we used a hedonic regression framework to adjust for key attributes of the housing unit, most importantly size and location. To control for inconsistently reported or unobserved measures of housing unit quality, we constructed each city's housing price index using a "rolling windows" approach.4 (Specifically, for each two-year window in our data, starting with 1890–1891 and ending with 2005–2006, we ran a hedonic regression. We then chained the results from each regression to obtain the implied annual changes in housing prices for the entire sample period.) This method allows us to separate the effect of improving housing quality from changes in the overall price level for the same housing unit, because the average quality of housing units within a city does not change very much over any two-year period.
Our combination of newspaper listings and a hedonic regression framework differs from other commonly used housing price series for the latter part of the 20th century, such as the FHFA's. In a recent journal article, one of this article's authors and her coauthors showed that despite these methodological differences, the HHP Project and FHFA series are substantially in agreement on housing price trends for metro areas between 1975 and 2006.5 Beyond lending credibility to our approach, this alignment suggests a simple way to extend the HHP Project series forward to the present day, which is to splice the corresponding metro area FHFA series to the HHP Project's housing price series for all 30 sample cities. The resulting series are the longest yet assembled for American metropolitan areas. All series in this article have been put in real terms and thus reflect changes in the quality-adjusted, inflation-adjusted price of housing in each city.
The Price of Housing, 1890–2024
Our series allow us to ask how the real price of housing changed in cities across the country from 1890 to 2024. We also produce a 30-city composite housing series, similar to the 20-city composite produced by S&P Cotality Case-Shiller.6 To construct the HHP Project's version, we aggregated our 30 city-level series using metropolitan area population, with populations interpolated between census years. The composite series thus places a larger weight on cities with a larger population.
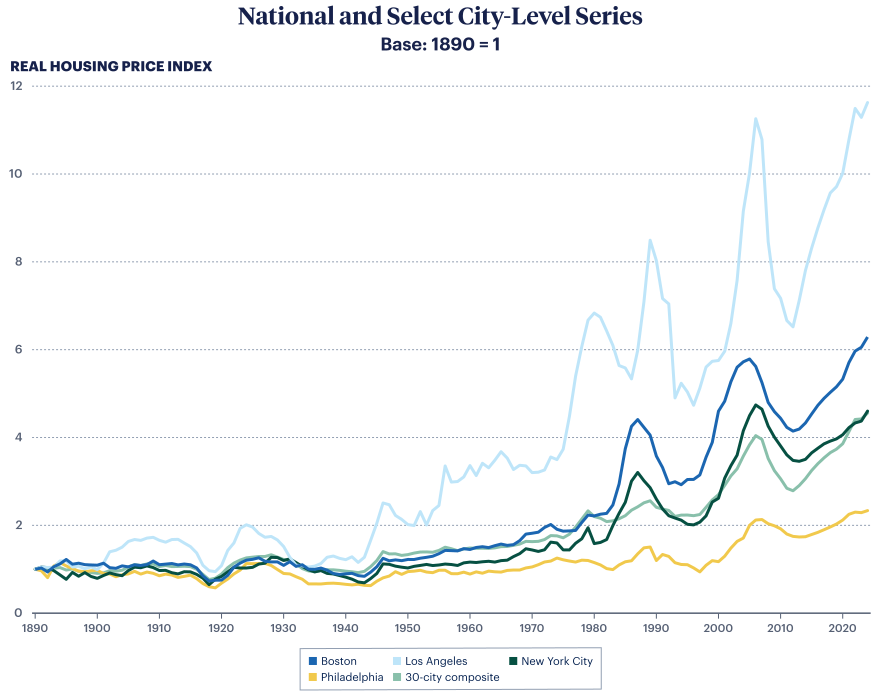
Our series provide new insight into the long-run trajectory of housing prices across major cities such as Boston, Los Angeles, New York, and Philadelphia (Figure 2). For instance, the HHP Project's series provide new evidence of how all housing markets fared during major episodes such as the Great Depression of the 1930s. Real sales prices began to rise in 1920, peaking in 1928 with an increase of 49 percent relative to the start of the decade. The stock market crash of 1929 and subsequent Great Depression decimated the housing market, and prices continued to fall for years. By 1939, housing prices had fallen by 36 percent relative to their pre-Depression highs. Nationally, housing prices did not return to their 1928 peak until 1946.
The HHP Project makes another important contribution by providing new evidence on when the period of substantial, sustained real housing price growth began in American cities. The turbulent years before World War II contrast with the stability that followed. Real housing prices rose by just 0.6 percent a year on average between 1946 and 1970, with no major booms or busts.
Figure 2
Source: The HHP Project at the Federal Reserve Bank of Philadelphia
Although the well-known Shiller index suggests that housing prices began increasing only after 1995, analysis of the housing value information from the census indicates that housing began to appreciate in real terms as of 1970.7 Overall, we find that nationally, housing prices were indeed increasing far earlier than 1995, which is consistent with evidence from the federal census. Price levels in our 30-city composite increased by 43 percent from 1970 to 1979, and unlike in previous booms, price levels remained high over the next decade as well. Although the dot-com crash of 2001 and the Great Recession that began in 2007 interrupted the upward trajectory of housing prices, the growth between 1970 and 2024 dwarfs what came before. The HHP Project series shows that, across the 30 cities in our sample, 2024 real house prices were larger by a factor of 4.5 relative to their 1890 values.
Differences Across U.S. Cities
Although events such as the Great Depression and the Great Recession are evident across the 30-city composite and individual city housing price series, there are substantial differences across the sample cities over the 134 years we study. For instance, at the beginning of the 20th century, East Coast cities followed similar trends whereas Los Angeles experienced a sizable housing boom-and-bust cycle around World War I. Yet the greatest divergence was yet to come.
By midcentury, different cities in the United States were already on different price trajectories. It's common knowledge that housing is now far more expensive in Los Angeles than in Philadelphia. But the HHP Project data show that this was not always the case. Before World War II, housing prices in both cities moved in tandem; in subsequent decades, housing price growth was below the national average in Philadelphia and far above average in Los Angeles.
These early gaps widened after 1970. Price growth in cities such as Boston and Los Angeles far exceeded growth in Philadelphia and in the country as a whole. From 1970 to 2007 (just before the Great Recession), housing price levels grew in real terms by 237 percent in Los Angeles and 223 percent in New York but just 103 percent in Philadelphia. The Great Recession pulled all markets down, but the same gaps reemerged in the 2010s. By 2024, housing price levels were just 134 percent of their 1890 level in Philadelphia but 1,062 percent in Los Angeles. These sharp differences in urban housing price levels show no signs of abating.
The Divergence in Housing Prices
Why did these differential price trajectories emerge, and why have they proven so persistent? To answer these questions, we need to look at supply, not just demand. In theory, demand for new housing will bid up the price of the existing stock of homes, increasing the incentive for developers to construct additional housing. If housing supply is reasonably elastic, which means that new housing appears in response to a run-up in prices, then real housing prices should eventually fall and, over time, price levels should remain steady. If demand cannot be met — for instance, because of regulatory barriers or a scarcity of developable land — then the price of housing will continue to increase.
Economists have studied how construction responded to growing housing demand after 1980.8 To understand this relationship further back in time, we use additional data from the Census Bureau's Building Permits Survey. Building permit information is more consistently available than building completions, and nearly complete annual series of building permits exist for all the cities in the HHP Project.
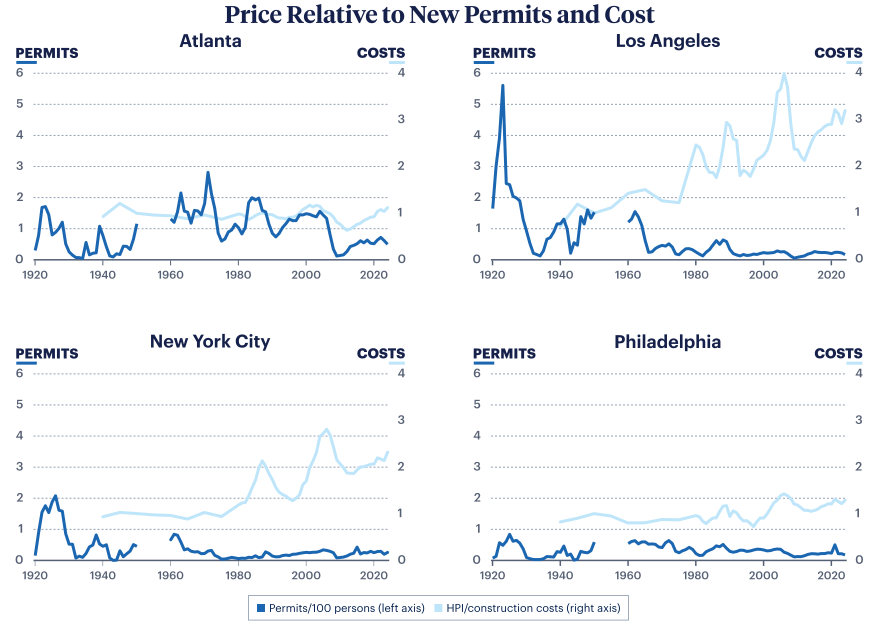
In some markets today, housing prices are much higher than construction costs. Recent research argues that this gap is driven by regulatory barriers to building new homes.9 So, we explored the relationship between construction costs and housing prices over the long run using data from the company RSMeans, which publishes a city-level historical cost index in physical volumes for every five years from 1940 to 1980 and annually thereafter. We scaled our housing price index (HPI) by this city-level construction cost index and charted the resulting series for four representative cities (Figure 3).
Figure 3
Source: The HHP Project at the Federal Reserve Bank of Philadelphia, RSMeans, the U.S. Bureau of Labor Statistics, and the U.S. Census Bureau
Note: This figure plots the series for permits issued by each sample city from 1920 to 1950 and permits issued by each sample metropolitan statistical area from 1960 to 2024. (The areas covered by the HHP Project newspaper data expand over time as cities evolved into metro areas.) We plot permitting activity relative to population as a measure of a city's housing construction intensity.
We find that demand and supply evolved similarly at first but then very differently across these four cities. Each city experienced a construction boom in response to surging prices during the 1920s. And in each city, price levels fell precipitously during the Great Depression, even without adjusting for construction costs.
But things changed when demand resurged after World War II. For example, a steady demand for housing was met with regular growth in the stock of homes in Atlanta. Permitting intensity in Atlanta was cyclical but frequently exceeded 1.5 new units per 100 persons from 1940 to 2000; it didn't fall below this level until the Great Recession. Other cities, however, did not build new homes in response to increasing demand. Although prices relative to construction costs began to surge in Los Angeles in the 1970s and New York City in the 1980s, permitting series show that construction per capita levels barely budged in both cities. In fact, New York City built more new homes in total in 1927 than in the entire period from 1965 to 1987. Although home price growth in these two cities has been cyclical, levels have continued to trend up, even through 2024.
What about cities in the industrial heartland? Philadelphia illustrates the typical experience of this region. The permitting-by-population series and the housing-price-relative-to-construction-costs series were both comparatively stable from 1940 to 2024. Housing prices relative to construction costs saw sustained growth in real terms only after 2000, but even this increase is modest compared with expensive coastal markets. We interpret this stability to mean that Philadelphia's existing housing stock at the beginning of the postwar period was sufficient to meet future demand. Prices remained relatively stable without a major boom in construction. Philadelphia's housing price index relative to costs has never risen above 1.3 in the last 70 years, the lowest of all indexed cities in the Northeast and Mid-Atlantic region.
Conclusion and Future Research
This summary analysis of long-run series from the Federal Reserve Bank of Philadelphia's HHP Project indicates that housing prices across U.S. cities have followed markedly different trajectories. We highlight the relationship between the construction of new homes and housing prices, but many questions remain. Why did housing demand vary so much over time and space, and why were some cities more responsive to new demand than others? Are restrictive zoning laws adopted in response to real price growth, or in the hopes of realizing price appreciation in the future? What can long-term trends tell us about the future of housing markets?
The long-run housing price series discussed in this article are available for public download from the Federal Reserve Bank of Philadelphia's HHP Project website.10 These series are the longest yet assembled for U.S. metro areas, and they provide researchers and policymakers with new insights into the differences across housing markets. Of particular interest is the recent struggle to find affordable housing in many cities. Now more than ever, we can clearly understand how today's prices and availability are shaped by yesterday's policies and construction decisions.
References
Davis, Morris A., François Ortalo-Magné, and Peter Rupert. "What's Really Happening in Housing Markets?" Federal Reserve Bank of Cleveland Economic Commentary (July 2007), https://www.clevelandfed.org/people/profiles/r/rupert-peter/ec-20070701-whats-really-going-on-in-housing-markets.
Glaeser, Edward, and Joseph Gyourko. "The Economic Implications of Housing Supply," Journal of Economic Perspectives, 32:1 (2018), pp. 3–30, https://doi.org/10.1257/jep.32.1.3.
Gyourko, Joseph, and Jacob Krimmel. "The Impact of Local Residential Land Use Restrictions on Land Values Across and Within Single Family Housing Markets," Journal of Urban Economics, 126:103374 (2021), https://doi.org/10.1016/j.jue.2021.103374.
Lyons, Ronan C., Allison Shertzer, Rowena Gray, and David Agorastos. "The Price of Housing in the United States, 1890–2006," Quarterly Journal of Economics, 141:1 (2026), pp. 559–603, https://doi.org/10.1093/qje/qjaf047.
Shiller, Robert J. Irrational Exuberance. Princeton, NJ: Princeton University Press, 2015, https://doi.org/10.1515/9781400865536.
Silver, Mick. "How to Better Measure Hedonic Residential Property Price Indexes," IMF Working Papers, 2016:213 (2016), https://doi.org/10.5089/9781475552249.001.
- The views expressed in this article are solely those of the authors and do not necessarily reflect the views of the Federal Reserve Bank of Philadelphia or the Federal Reserve System.
- We collected our data from the U.S. Federal Housing Finance Agency via FRED. Specifically, we looked at the house price indices (2020-01-01 = 1, not seasonally adjusted) for the Philadelphia, PA, and Miami–Miami Beach–Kendall, FL, MSADs.
- The HHP Project's housing price series cover a geographic area that grows over time for each city, reflecting population growth and urban expansion. This area is typically the existing city in 1890, which then expands to approximately the metro area by 1960. We use the term "city" to refer to this geography throughout the article.
- Before World War II, "housing unit size" typically referred to the total number of rooms. Since then, listings more typically feature separate numbers for bedrooms and bathrooms.
- See Silver (2016).
- See Lyons et al. (2026).
- Visit S&P Dow Jones Indices LLC via FRED (https://fred.stlouisfed.org/series/CSUSHPINSA) to look at its S&P Cotality Case-Shiller U.S. National Home Price Index.
- See Shiller (2015) and Davis et al. (2007).
- See Glaeser and Gyourko (2018).
- See Gyourko and Krimmel (2021).
- Visit the Federal Reserve Bank of Philadelphia's Historical Housing Prices Project at https://www.philadelphiafed.org/surveys-and-data/regional-economic-analysis/historical-housing-prices.