Federal Reserve Bank of Philadelphia
skip to main content
skip to footer
Search
Expand Menu
About Us
Our People
Education
Banking
Careers
Calendar of Events
The Economy
Expand Sub-Topics
Monetary Policy
Banking & Financial Markets
Macroeconomics
Regional Economics
Consumer Finance
Expand Sub-Topics
Payment Systems
Consumer Credit
Education Finance
Mortgage Markets
Community Development
Expand Sub-Topics
Inclusive Growth
Credit & Capital
Housing & Neighborhoods
Workforce & Economic Development
SURVEYS & DATA
Expand Sub-Topics
REAL-TIME DATA RESEARCH
Regional Economic Analysis
CONSUMER FINANCE DATA
COMMUNITY DEVELOPMENT DATA
Search
Federal Reserve Bank of Philadelphia
Surveys & Data
State Coincident Indexes
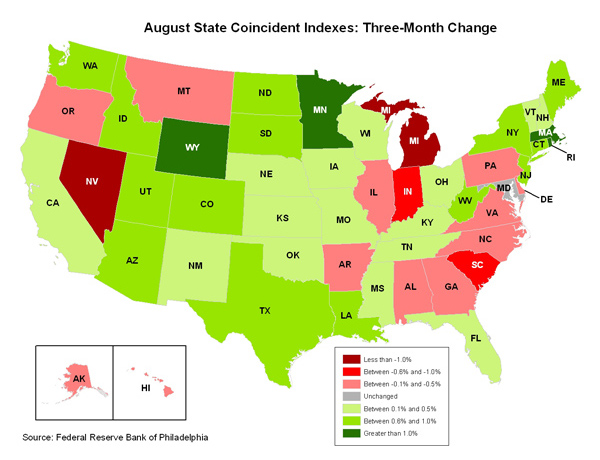
State Coincident Indexes August 2011
State Coincident Indexes August 2011
Three-Month Change
August 2011
Share