State Coincident Indexes
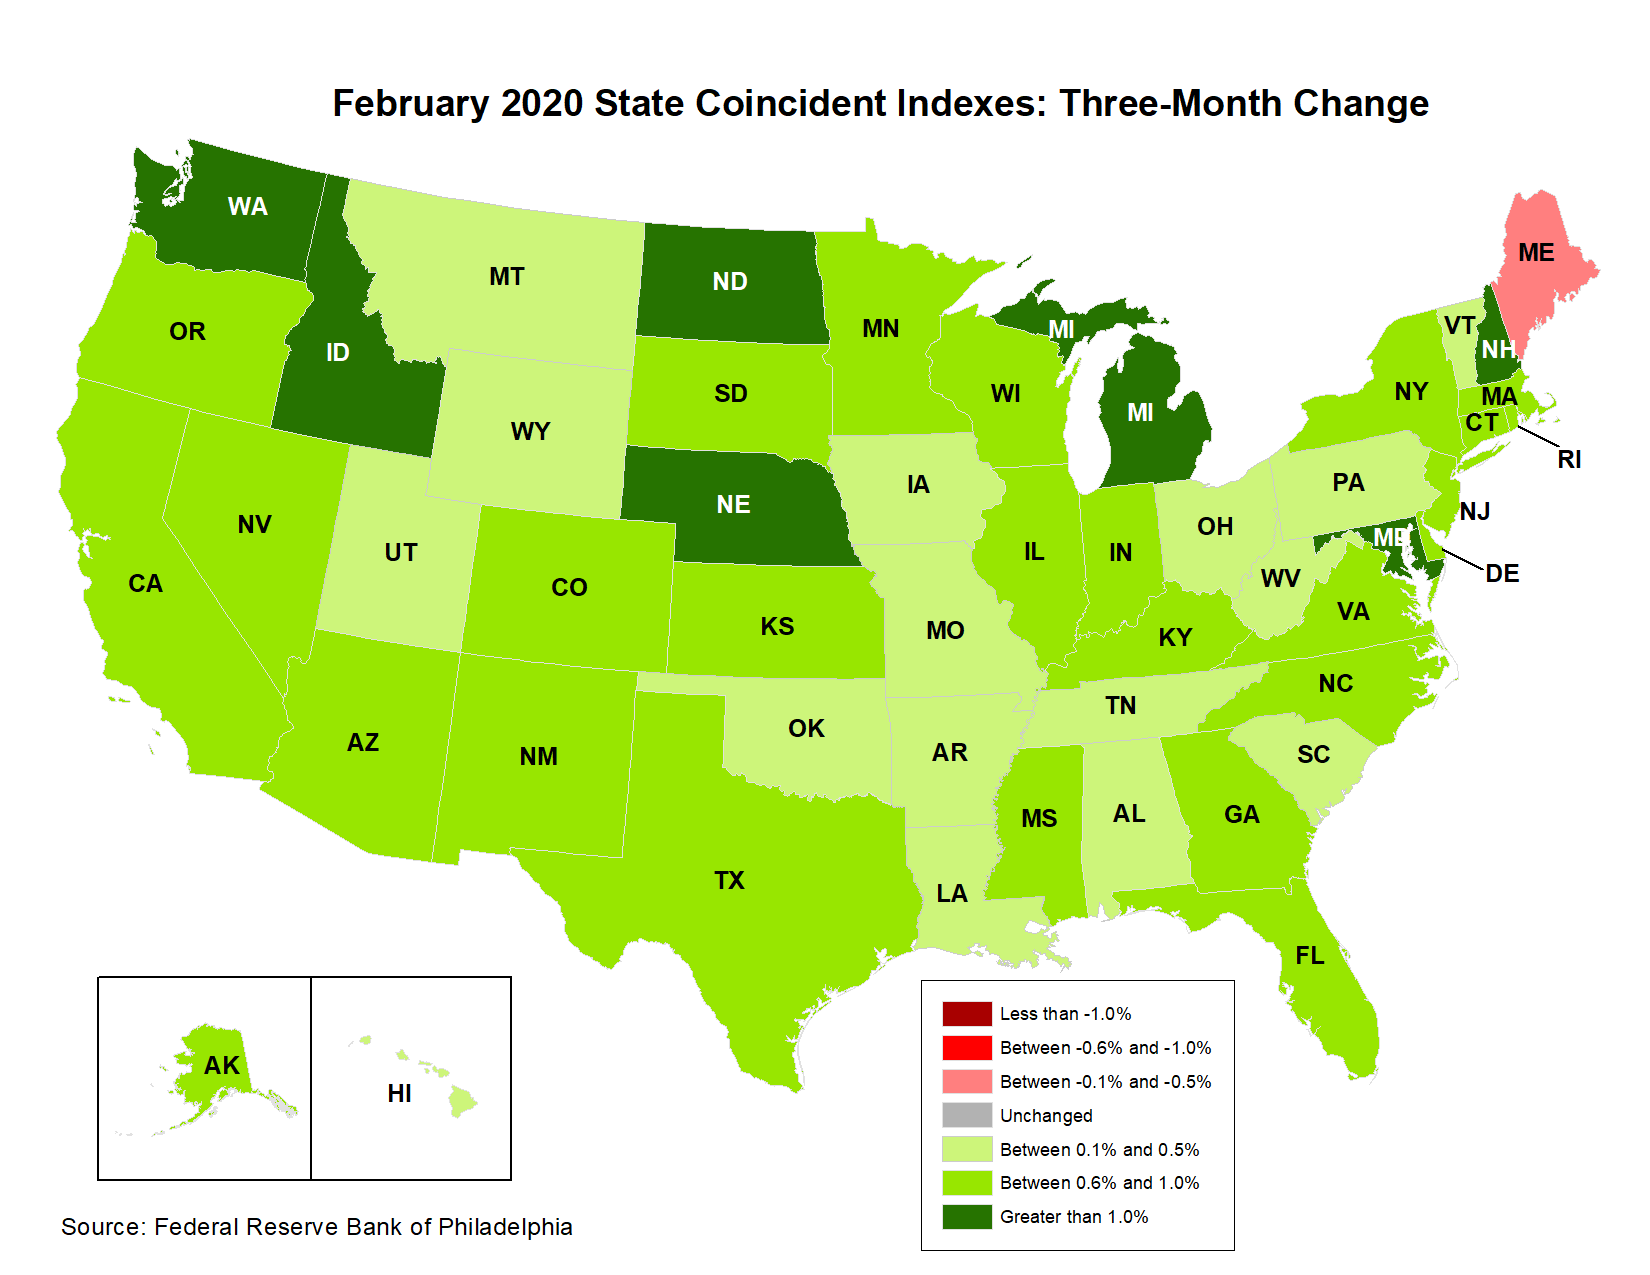
February’s coincident indexes show increased economic activity in 49 states over the past three months.
Return to the main page for the State Coincident Indexes.
Share
February’s coincident indexes show increased economic activity in 49 states over the past three months.
Return to the main page for the State Coincident Indexes.
Share