Nonmanufacturing Business Outlook Survey
July 2026 Report
Note: Survey responses were collected from July 6 to July 16.
Jump to
Summary of ReturnsView a PDF version of this report | View a TXT version of this report
Nonmanufacturing activity in the region expanded overall, according to the firms responding to the July Nonmanufacturing Business Outlook Survey. The indexes for firm-level general activity, new orders, and sales/revenues all rose this month. Both full- and part-time employment indicators moved higher this month and suggest overall increases in employment. The prices paid and prices received indexes continued to suggest overall price increases. Expectations for growth over the next six months were more widespread this month.
Most Current Indexes Increase
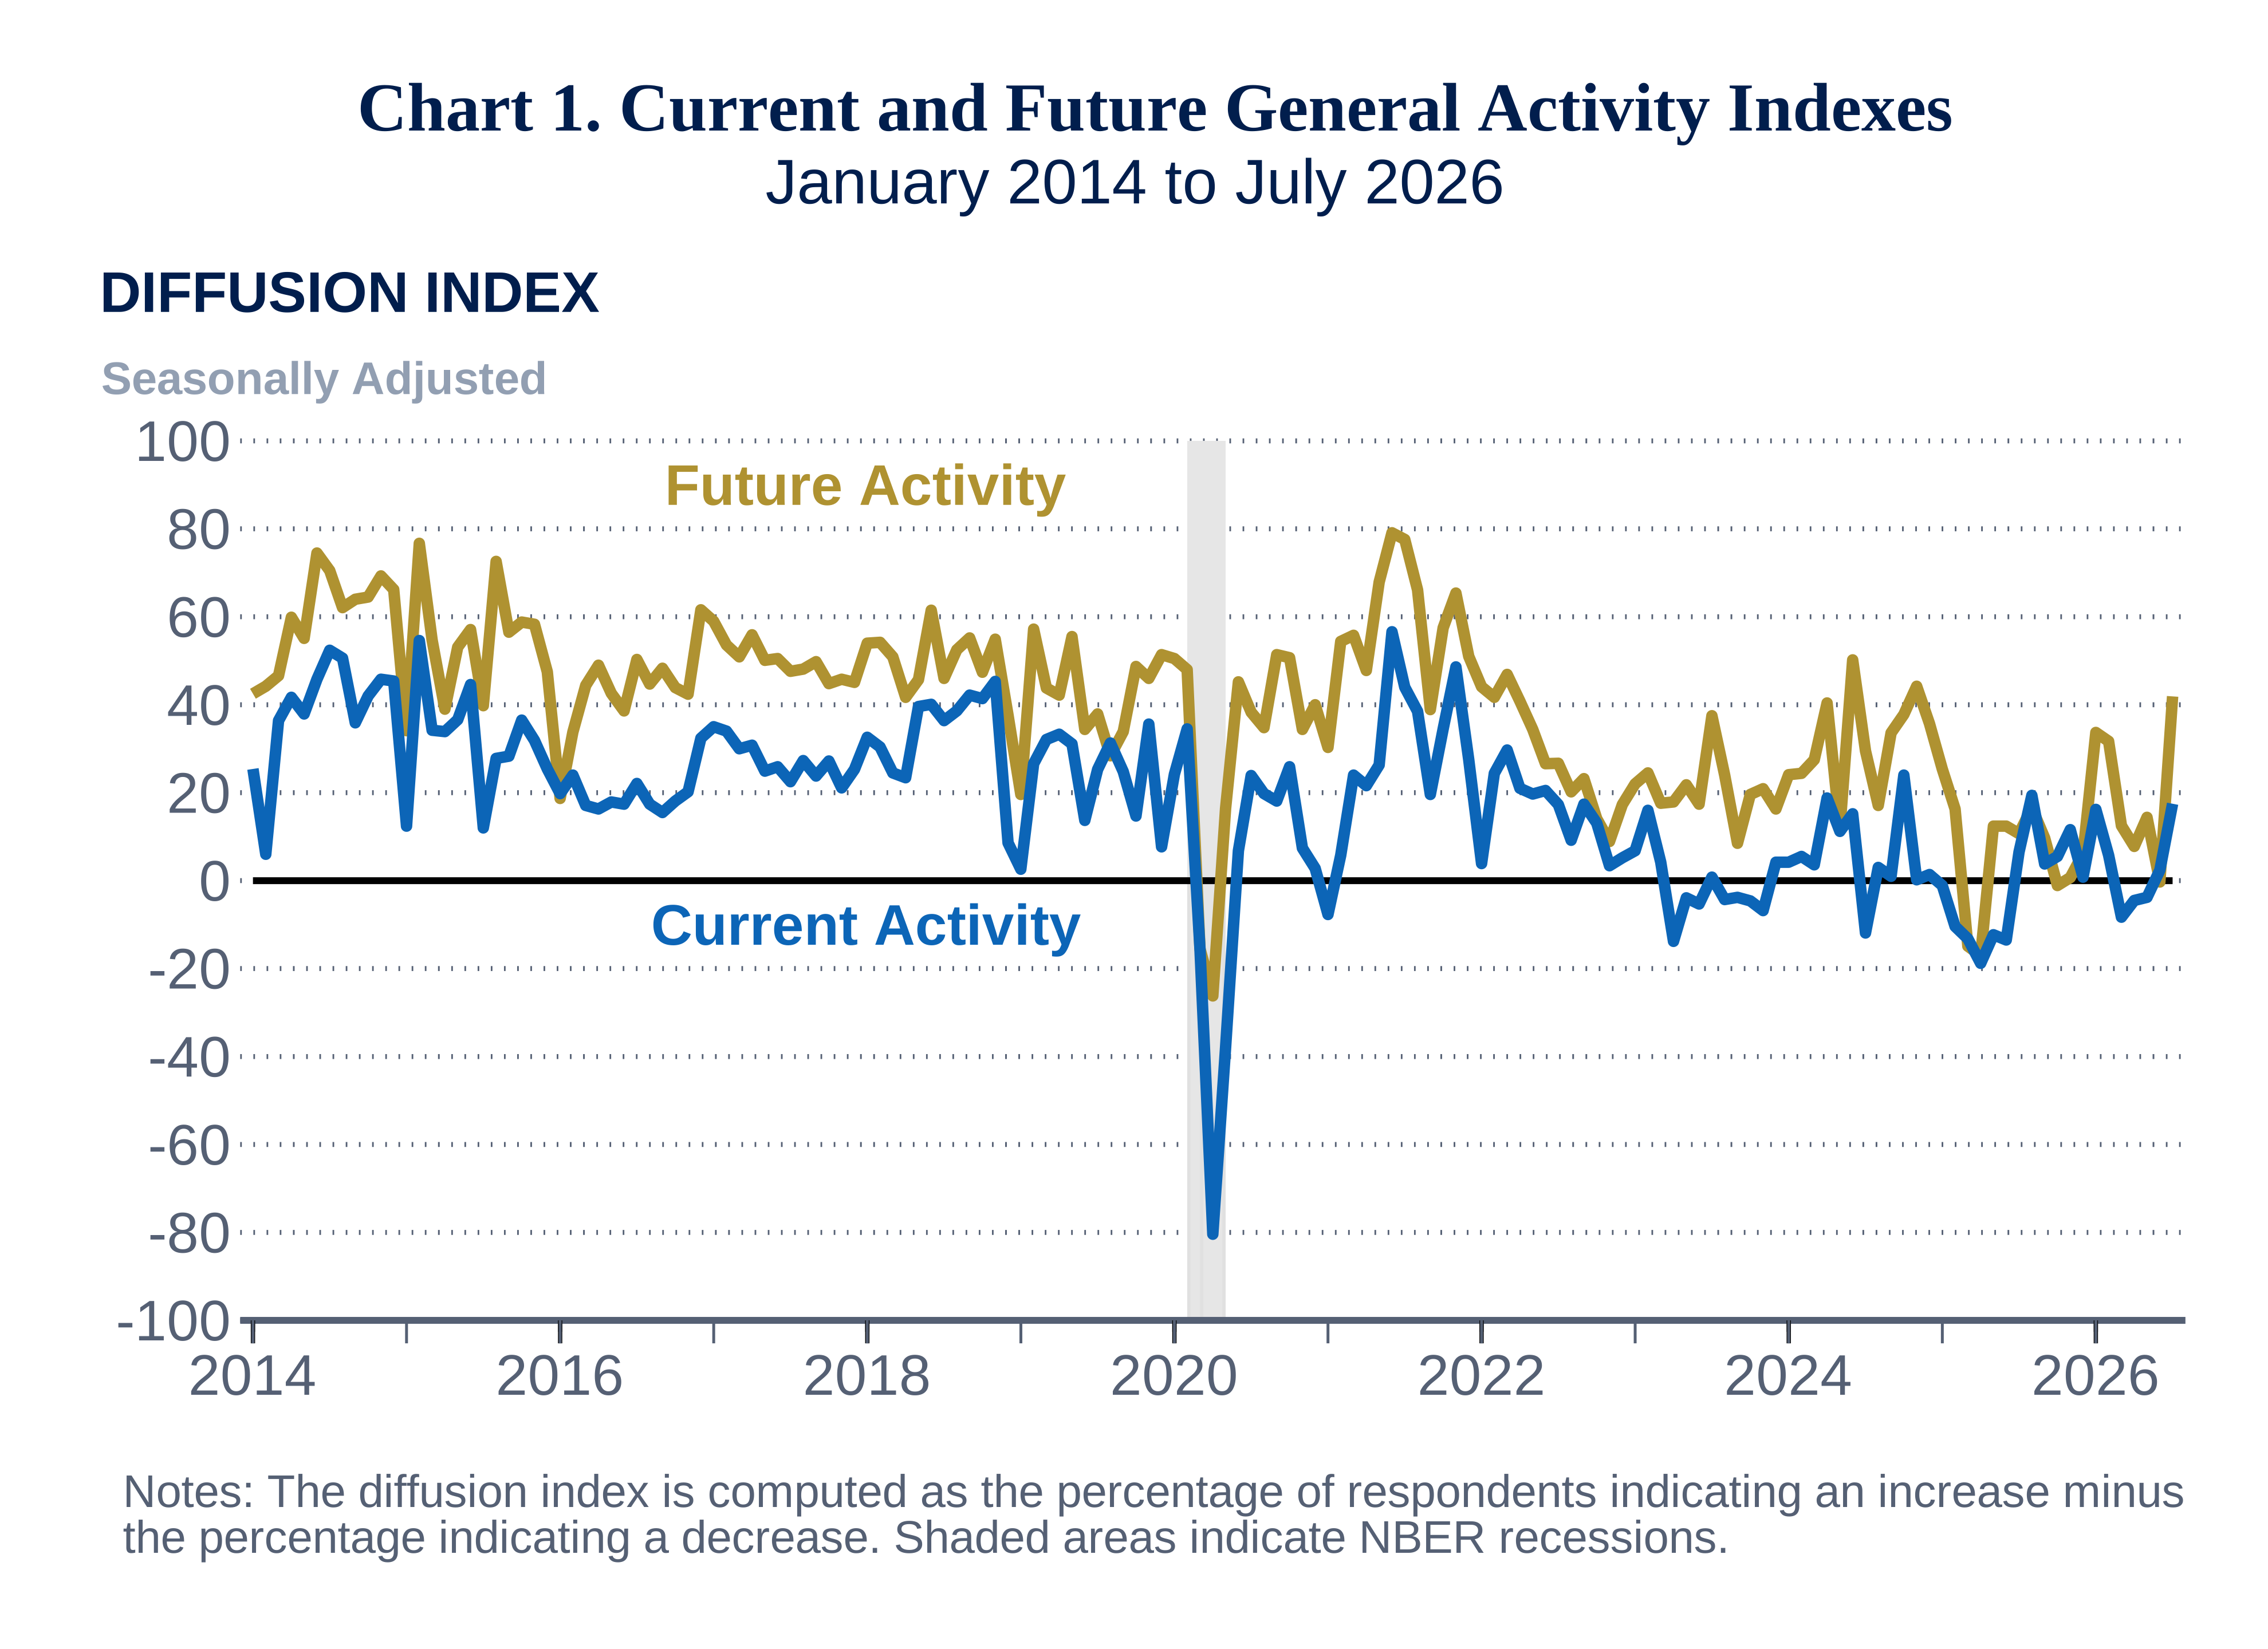
The diffusion index for current general activity at the firm level rose 15 points to 17.5, its highest reading since August (see Chart 1). Almost 28 percent of the firms reported increases (up from 25 percent last month), 10 percent reported decreases (down from 22 percent), and 55 percent reported no change in activity (up from 53 percent). Similarly, the new orders index increased 13 points to 12.5, its highest reading since August. More than 27 percent of the firms reported increases in new orders, 15 percent reported decreases, and 34 percent reported no change. The sales/revenues index moved up 4 points to 23.5, its highest reading since January. The regional activity index jumped 33 points to 7.4, its first positive reading since October 2024.
Firms Report Overall Increases in Employment
The full-time employment index increased 17 points to 12.4 this month, its first positive reading since February and its highest reading since January 2024. Almost 18 percent of the firms reported increases in full-time employment, 5 percent reported decreases, and 76 percent reported steady employment levels. The part-time employment index rose 12 points to 12.1 this month, its highest reading since December.
Firms Continue to Report Price Increases
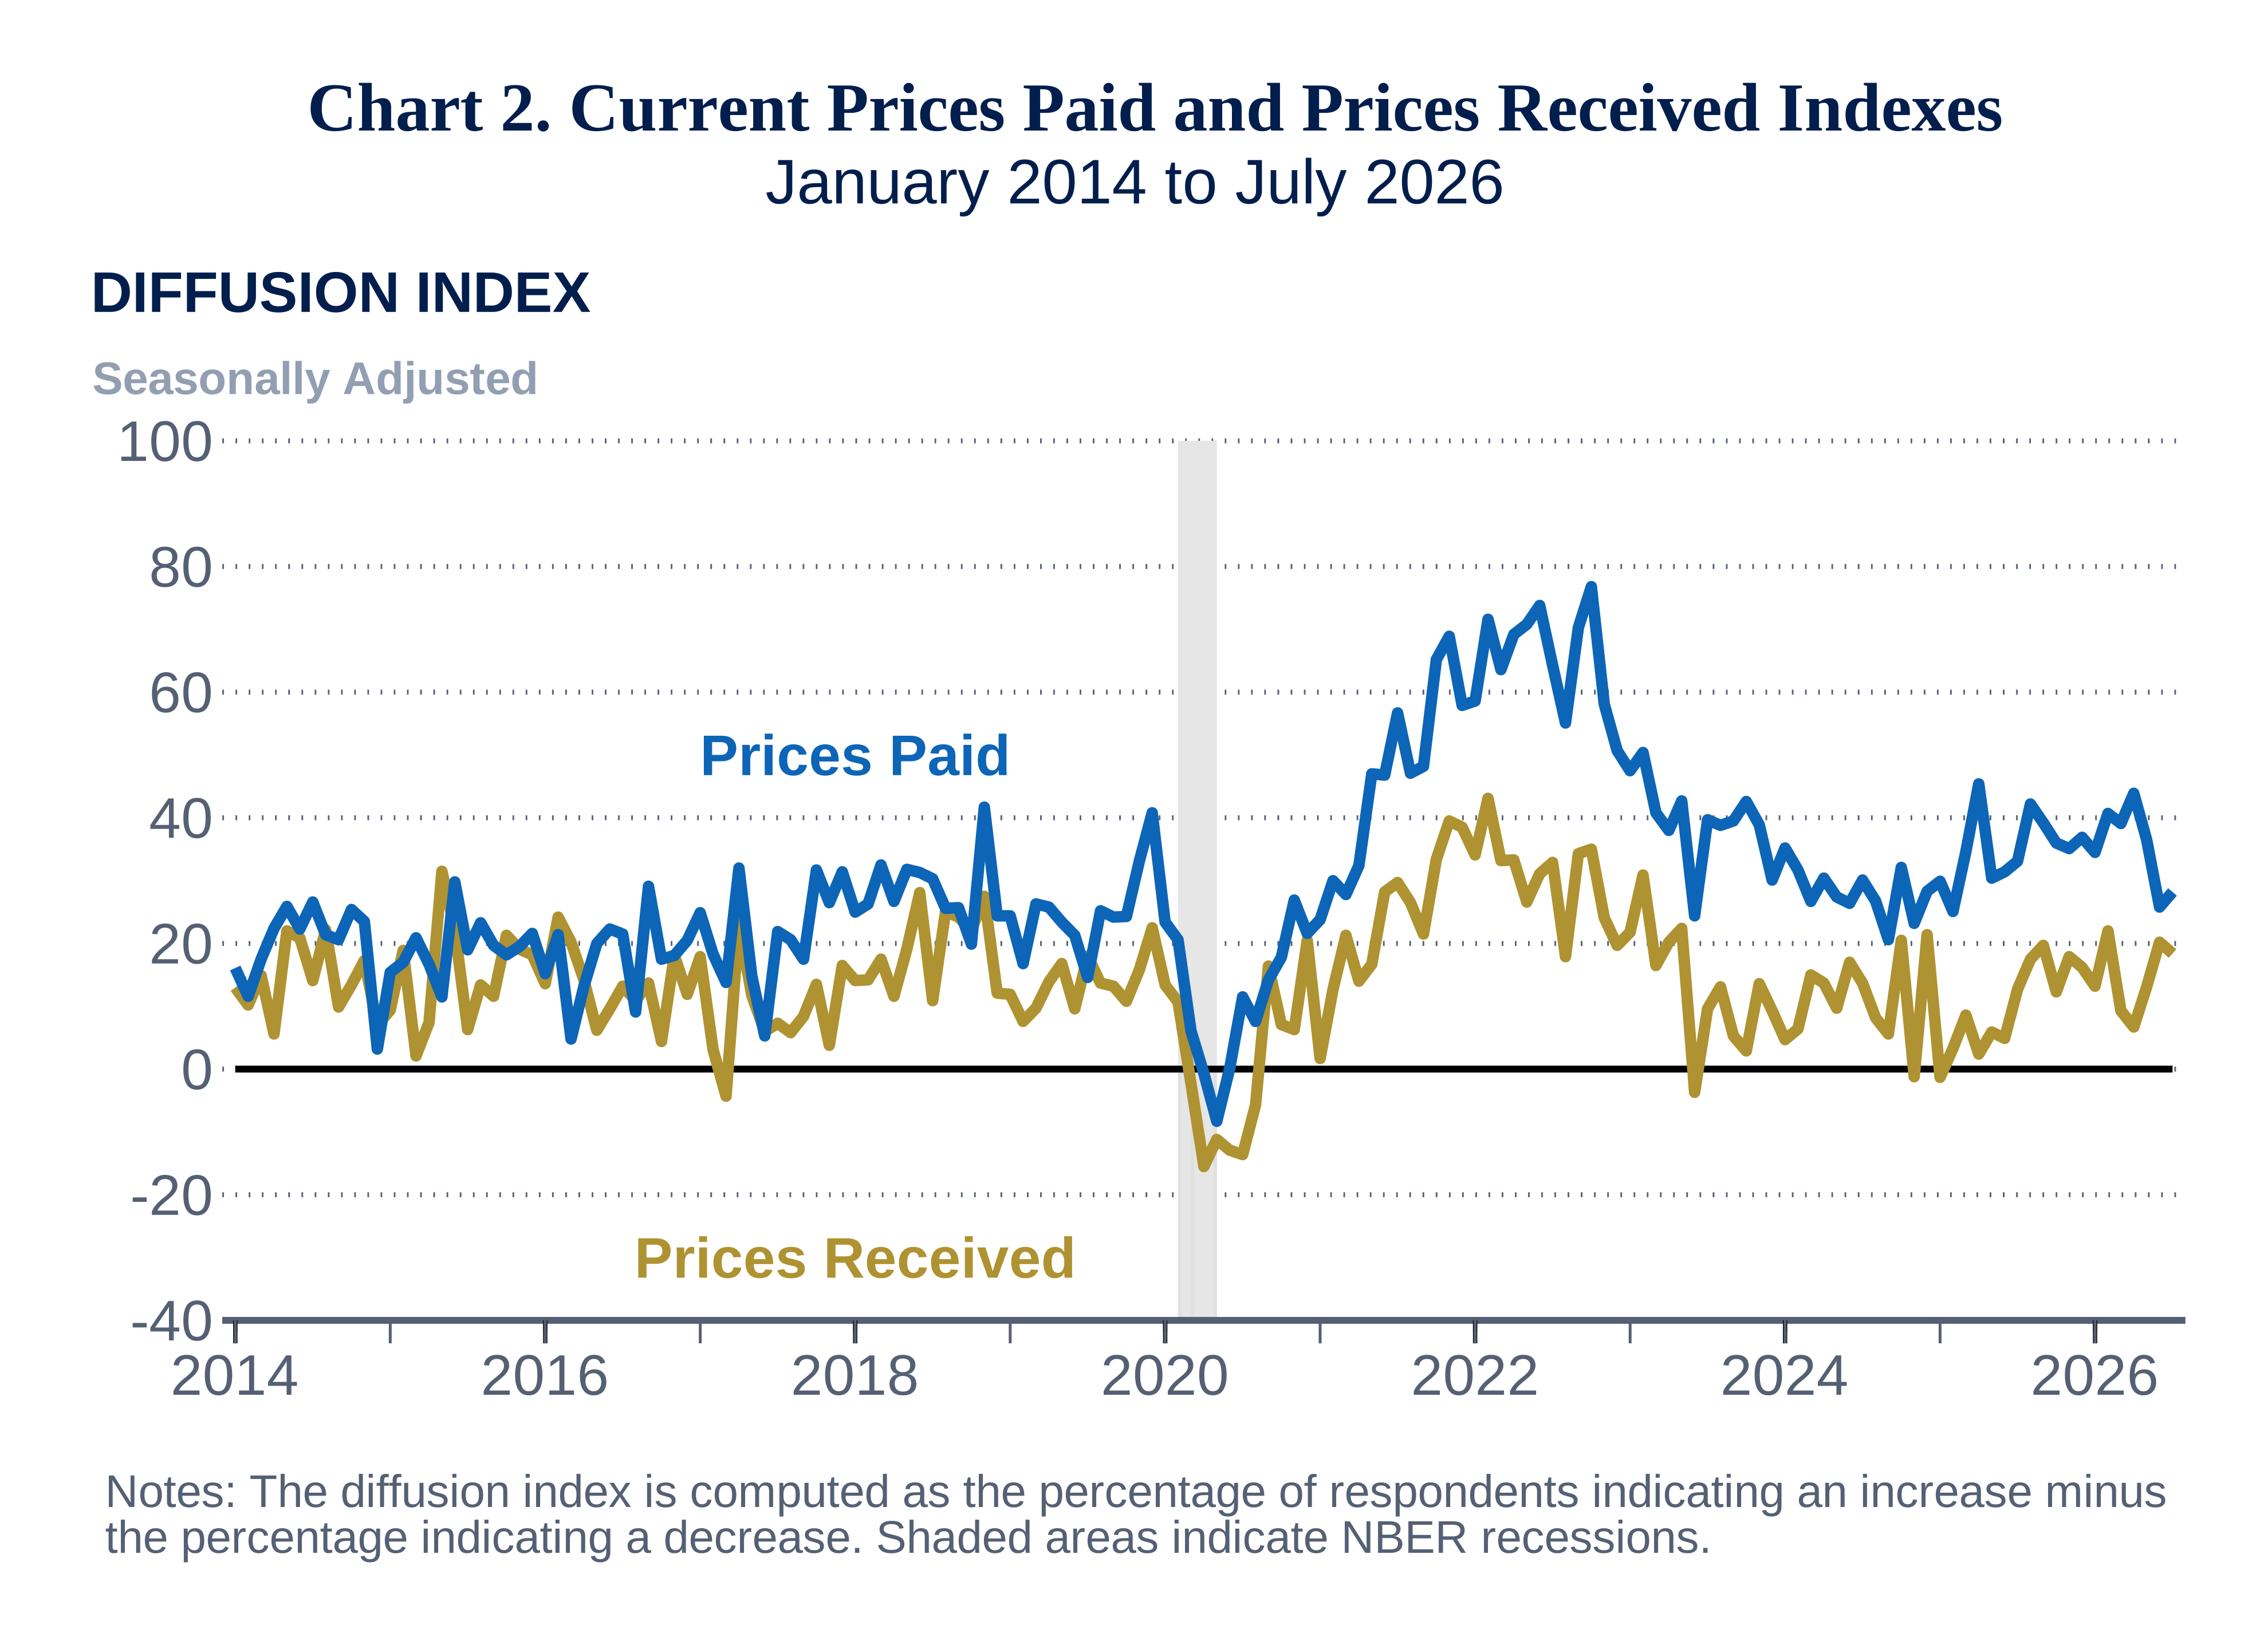
The prices paid index edged up 2 points to 28.2 this month (see Chart 2). Almost 37 percent of the respondents reported higher input prices, 42 percent reported no change, and 9 percent reported lower input prices. Regarding prices for the firms’ own goods and services, the prices received index edged down 2 points to 18.4. More than 21 percent of the firms reported increases in prices received, and 3 percent reported decreases. Over 70 percent of the firms reported no change in prices for their own goods and services.
Firms Continue to Expect Increases in Wages
In this month's special questions, the firms were asked about changes in wage rates and compensation packages over the past three months, as well as their updated expectations for changes in various input and labor costs for the current year. Almost 41 percent of the firms indicated wages and compensation costs had increased over the past three months, 57 percent reported no change, and 3 percent reported decreases. In terms of changes to their 2026 plan for wages and compensation since the beginning of the year, 32 percent of the firms reported that they are planning for an increase, 3 percent reported they are planning for a decrease, and 65 percent have not made any changes.
The median expectations for various costs for labor and inputs moved down from when the firms were last asked in April, except for firms’ expectations for nonhealth benefits costs, which stayed the same. The firms now expect an increase of 2 to 3 percent for wages, down from 3 to 4 percent in April, and an increase of 4 to 5 percent for total compensation, down from a range of 7.5 to 10 percent. The median expected increase in energy costs fell to 3 to 4 percent from 5 to 7.5 percent in April.
Firms Anticipate Growth
The respondents expect growth both at their own firms and in the region over the next six months, and these expectations were more widespread this month. The diffusion index for future general activity at the firm level jumped from near zero to 41.9, its highest reading since November 2024 (see Chart 1). More than 49 percent of the firms expect an increase in activity at their firms over the next six months (up from 34 percent last month), 8 percent expect decreases (down from 34 percent), and 43 percent expect no change (up from 30 percent). The future regional activity index rose 26 points to 15.7, its highest reading since January 2025.
Summary
Responses to this month’s Nonmanufacturing Business Outlook Survey suggest an overall increase in nonmanufacturing activity among the firms in the region. The indicators for the firm-level general activity, new orders, and sales/revenues all rose this month. Both employment indexes rose and suggest overall increases in employment. The price indexes continued to indicate increases in prices. Expectations for growth at the firm level over the next six months were more widespread this month.
Special Questions (July 2026)
|
|
Percent (%) |
|---|---|
| Increased | 40.5 |
| No change | 56.8 |
| Decreased | 2.7 |
|
|
Percent (%) |
|---|---|
| Yes, and we are planning to increase wage rates and compensation packages. | 32.4 |
| Yes, and we are planning to decrease wage rates and compensation packages. | 2.9 |
| No, we have not made changes to wage rates and compensation packages. | 64.7 |
| Energy (%) |
Other Raw Materials (%) |
Intermediate Goods (%) |
Wages (%) |
Health Benefits (%) |
Nonhealth Benefits (%) |
Wages + Health Benefits + Nonhealth Benefits (%) | |
|---|---|---|---|---|---|---|---|
| Decline of more than 1% | 17.6 | 12.5 | 11.1 | 2.9 | 0.0 | 3.2 | 6.7 |
| No change | 5.9 | 16.7 | 16.7 | 20.6 | 11.8 | 32.3 | 6.7 |
| Increase of 1–2% | 8.8 | 16.7 | 27.8 | 8.8 | 0.0 | 12.9 | 3.3 |
| Increase of 2–3% | 11.8 | 20.8 | 5.6 | 26.5 | 8.8 | 9.7 | 13.3 |
| Increase of 3–4% | 14.7 | 4.2 | 11.1 | 20.6 | 5.9 | 29.0 | 13.3 |
| Increase of 4–5% | 5.9 | 4.2 | 16.7 | 8.8 | 14.7 | 9.7 | 13.3 |
| Increase of 5–7.5% | 11.8 | 20.8 | 11.1 | 8.8 | 17.6 | 3.2 | 10.0 |
| Increase of 7.5–10% | 11.8 | 0.0 | 0.0 | 0.0 | 11.8 | 0.0 | 10.0 |
| Increase of 10–12.5% | 5.9 | 4.2 | 0.0 | 2.9 | 17.6 | 0.0 | 13.3 |
| Increase of more than 12.5% | 5.9 | 0.0 | 0.0 | 0.0 | 11.8 | 0.0 | 10.0 |
| Median Expected Change | 3–4 | 2–3 | 1–2 | 2–3 | 5–7.5 | 2–3 | 4–5 |
|
Median Expected Change (April 2026) |
5–7.5 | 3–4 | 4–5 | 3–4 | 7.5–10 | 2–3 | 7.5–10 |
| *The firms responded to more detailed changes than shown in the provided ranges. | |||||||
NBOS Summary of Returns – July 2026
| July vs. June | |||||||
|---|---|---|---|---|---|---|---|
|
Previous Diffusion Index |
Increase | No change | Decrease |
Diffusion Index |
|||
| What is your assessment of general business activity for the region? | -25.8 | 20.2 | 60.3 | 12.8 | 7.4 | ||
| What is your assessment of general business activity for your firm? | 2.4 | 27.8 | 55.2 | 10.3 | 17.5 | ||
| Company Business Indicators | |||||||
| New Orders | -0.7 | 27.1 | 33.5 | 14.6 | 12.5 | ||
| Sales or Revenues | 19.6 | 36.5 | 44.3 | 13.0 | 23.5 | ||
| Unfilled Orders | 1.0 | 10.6 | 34.3 | 5.0 | 5.7 | ||
| Inventories | -1.2 | 1.9 | 30.0 | 5.7 | -3.8 | ||
| Prices Paid | 25.8 | 36.8 | 42.3 | 8.6 | 28.2 | ||
| Prices Received | 20.2 | 21.4 | 70.1 | 3.0 | 18.4 | ||
| Number of Employees – Full-Time Permanent | -4.8 | 17.7 | 76.4 | 5.3 | 12.4 | ||
| Number of Employees – Part-Time, Temporary, and Contract | 0.1 | 16.3 | 67.5 | 4.2 | 12.1 | ||
| Average Employee Workweek | 0.3 | 18.0 | 74.8 | 7.2 | 10.8 | ||
| Wage and Benefit Costs | 39.7 | 37.1 | 62.3 | 0.0 | 37.1 | ||
| Capital Expenditures – Physical Plant | 4.9 | 20.2 | 44.9 | 6.1 | 14.1 | ||
| Capital Expenditures – Equipment and Software | 15.0 | 31.7 | 54.6 | 0.9 | 30.8 | ||
| Six Months from Now vs. July | |||||||
|
Previous Diffusion Index |
Increase | No change | Decrease |
Diffusion Index |
|||
| What is your assessment of general business activity for the region? | -10.5 | 28.4 | 55.4 | 12.6 | 15.7 | ||
| What is your assessment of general business activity for your firm? | -0.3 | 49.3 | 43.2 | 7.5 | 41.9 | ||
| Notes: (1) Diffusion indexes represent the percentage of respondents indicating an increase minus the percentage indicating a decrease. (2) All data are seasonally adjusted. (3) Percentages may not sum to 100 because of rounding, omission by respondents, or both. (4) Survey results reflect data received through July 16, 2026. Federal Reserve Bank of Philadelphia Nonmanufacturing Business Outlook Survey Released: July 21, 2026, at 8:30 a.m. ET. |
|||||||