Nonmanufacturing Business Outlook Survey
May 2026 Report
Jump to
Summary of ReturnsView a PDF version of this report | View a TXT version of this report
Nonmanufacturing activity in the region continued to decline, according to the firms responding to the May Nonmanufacturing Business Outlook Survey. The indexes for general activity at the firm level and new orders remained negative, and the sales/revenues index turned negative. The firms reported mostly steady employment, but the index remained slightly negative. The prices paid index declined, while the prices received index moved higher; however, both indexes continue to indicate increases in prices. The respondents continue to expect growth at their own firms over the next six months.
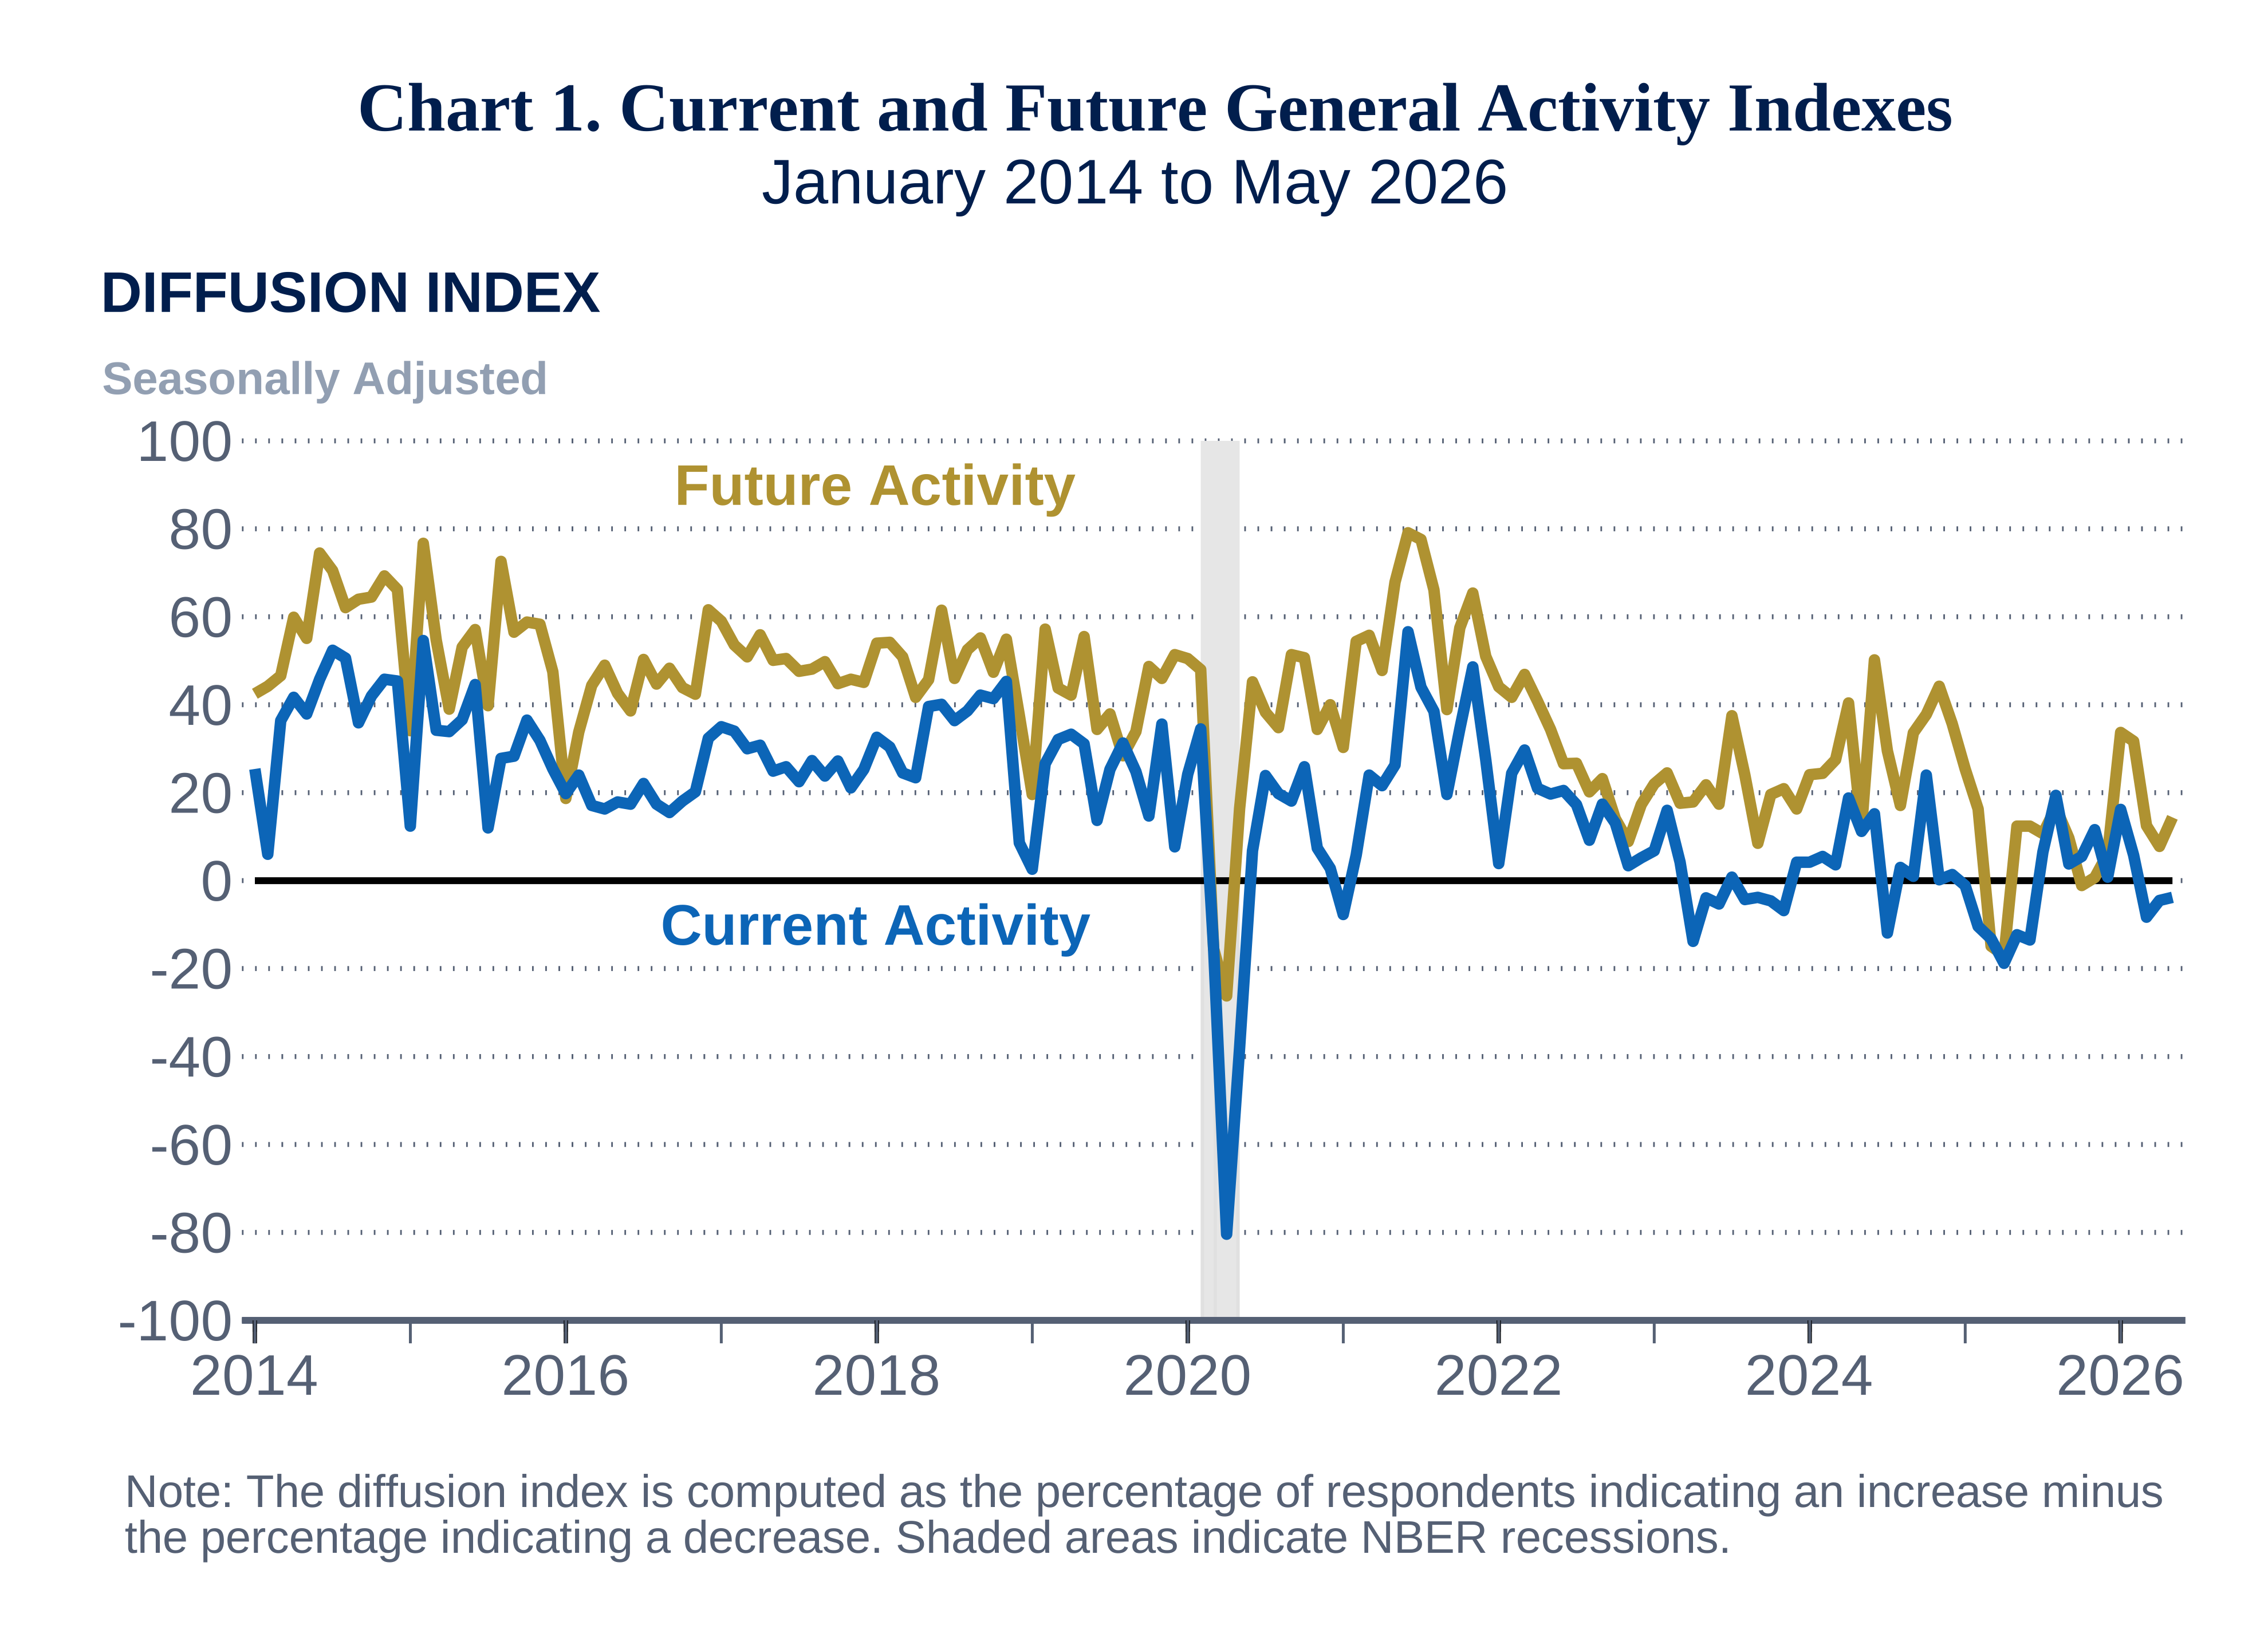
Current Indexes Remain Weak
The diffusion index for current general activity at the firm level ticked up 1 point to -3.8, its third consecutive negative reading (see Chart 1). Nearly 30 percent of the firms reported decreases, 26 percent reported increases, and 43 percent reported no change in activity. The new orders index rose 16 points to -0.8, its fourth consecutive negative reading. The sales/revenues index fell 10 points to -7.6, its first negative reading since May 2025. Almost 34 percent of the firms reported decreases in sales/revenues (up from 27 percent last month), while 26 percent reported increases (down from 29 percent); 37 percent reported no change (down from 44 percent). The regional activity index remained negative and fell 7 points to -23.6.
Most Firms Report Steady Employment
The full-time employment index increased 4 points to -1.1 this month. Most firms (72 percent) reported steady full-time employment levels, while the share of firms reporting decreases (15 percent) narrowly exceeded the share reporting increases (14 percent). The part-time employment index rose 4 points to 5.4 this month.
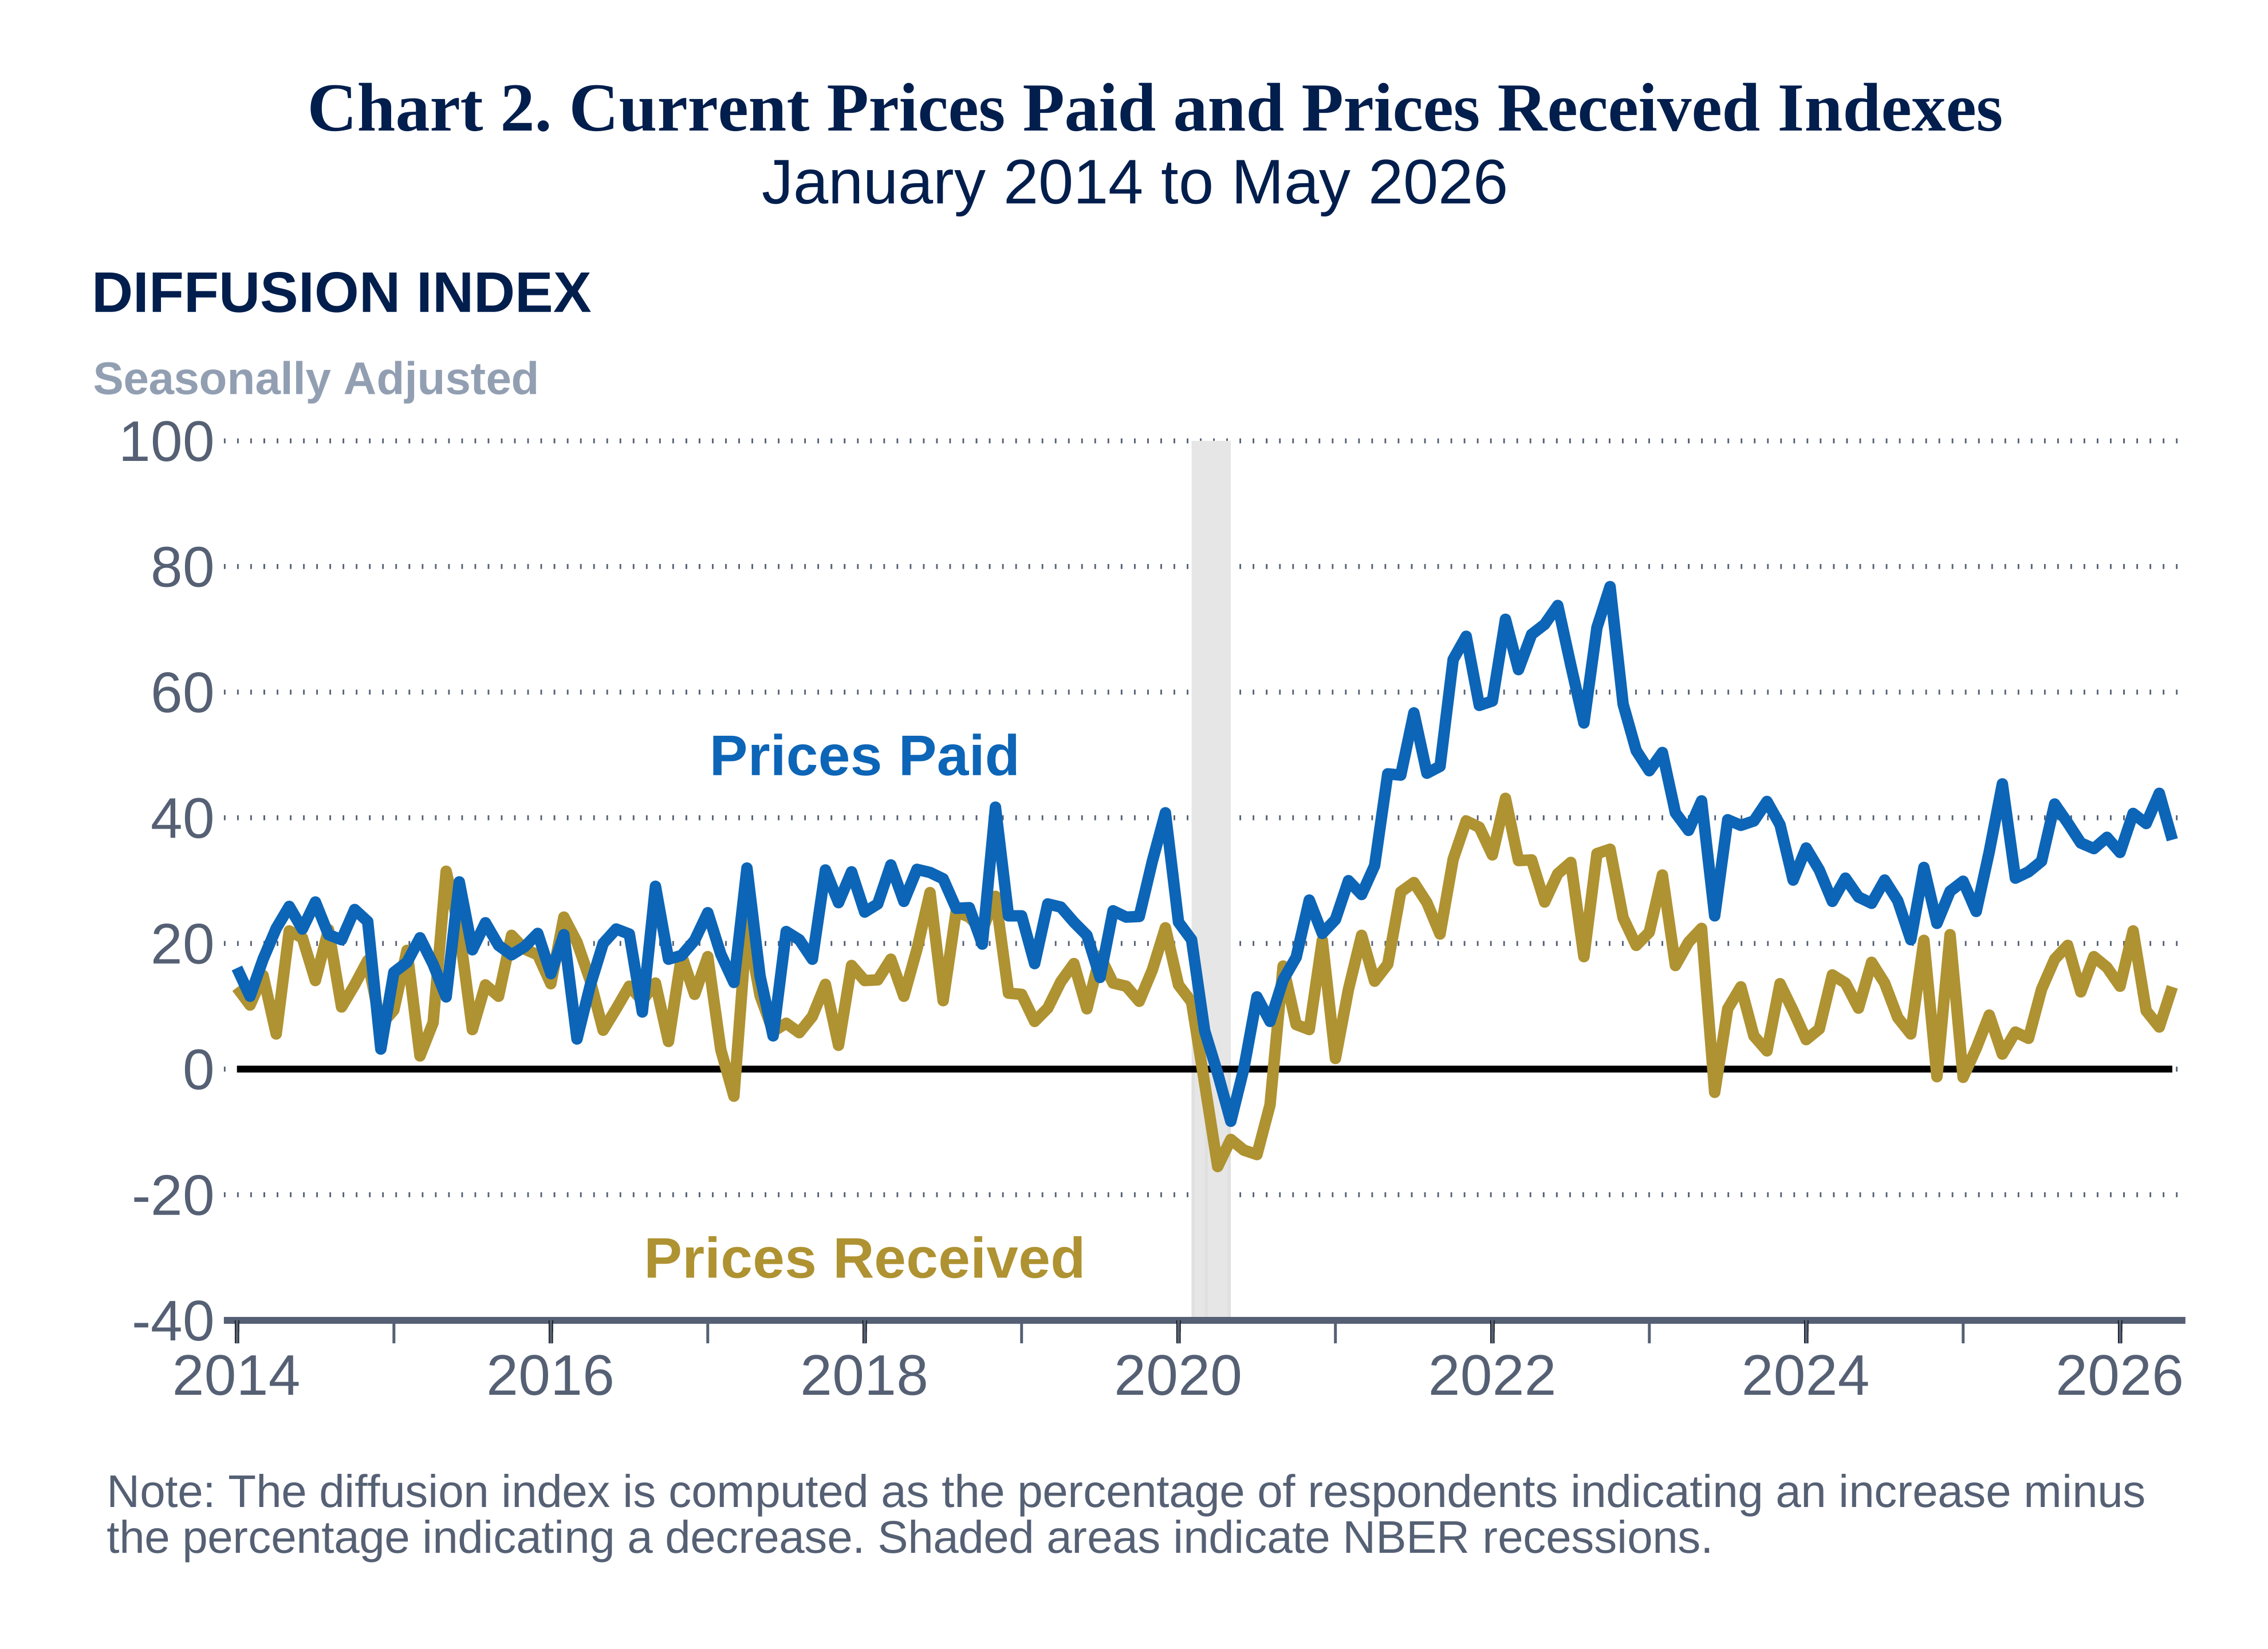
Firms Continue to Report Price Increases
The prices paid index moved down 7 points to 36.5 this month, more than offsetting the index’s increase in April (see Chart 2). More than 42 percent of the respondents indicated higher input prices (down from 50 percent last month), 6 percent indicated lower input prices (unchanged), and 42 percent reported no change (up from 26 percent). Regarding prices for the firms’ own goods and services, the prices received index rose 6 points to 13.1 this month, near its long-run average. More than 23 percent of the firms reported increases in prices received, 10 percent reported decreases, and 48 percent reported no change in prices for their own goods and services.
Similar Share of Firms Expects Near-Term Changes to Costs Relative to Last Quarter
In this month’s special questions, the firms were asked about changes in core customer price sensitivity and anticipated cost changes. Almost 54 percent of the firms reported that their customers were more price sensitive compared with last quarter, while 41 percent reported customers’ sensitivity was about the same. More than 54 percent of the firms anticipated changes in their industry’s costs in the near term (similar to the 56 percent last quarter), and of those firms, 30 percent expected their competitors to raise prices in response, while 20 percent expected competitors to lower prices. Regarding when these price changes will occur, the firms’ median expectation was for competitors to change prices in the next three months.
Firms Anticipate Growth
The respondents continue to expect growth at their own firms over the next six months, and expectations were more widespread this month. The diffusion index for future general activity at the firm level rose for the first time in four months, increasing 7 points to 14.4 (see Chart 1). More than 40 percent of the firms expect an increase in activity at their firms over the next six months, 26 percent expect decreases, and 32 percent expect no change. The future regional activity index fell 16 points to -9.6, its lowest reading since December.
Summary
Responses to this month’s Nonmanufacturing Business Outlook Survey suggest an overall decline in nonmanufacturing activity among the firms in the region. The indicators for firm-level general activity and new orders both remained negative. The sales/revenues index also fell into negative territory. The full-time employment index suggested mostly steady employment overall. The price indexes moved in different directions, but both continued to indicate increases in prices overall. Expectations for growth at the firm level over the next six months were more widespread this month.
Special Questions (May 2026)
|
|
Percent (%) |
|---|---|
| More sensitive | 53.8 |
| About the same | 41.0 |
| Less sensitive | 2.6 |
| Don't know | 2.6 |
|
|
Percent (%) |
|---|---|
| Yes | 54.1 |
| No | 45.9 |
|
|
Percent (%) |
|---|---|
| Raise prices | 30.0 |
| Hold prices steady | 45.0 |
| Lower prices | 20.0 |
| Don't know | 5.0 |
| *Only firms that responded “yes” to question 2 responded to question 2a. |
|
|
Number of months |
|---|---|
| Median response | 3.0 |
| **Only firms that responded “raise prices” or “lower prices” to question 2a responded to question 2b. | |
NBOS Summary of Returns – May 2026
| May vs. April | |||||||
|---|---|---|---|---|---|---|---|
|
Previous Diffusion Index |
Increase | No change | Decrease |
Diffusion Index |
|||
| What is your assessment of general business activity for the region? | -16.5 | 11.6 | 47.6 | 35.2 | -23.6 | ||
| What is your assessment of general business activity for your firm? | -4.5 | 25.9 | 43.3 | 29.7 | -3.8 | ||
| Company Business Indicators | |||||||
| New Orders | -16.9 | 20.7 | 38.0 | 21.4 | -0.8 | ||
| Sales or Revenues | 2.5 | 26.1 | 37.4 | 33.7 | -7.6 | ||
| Unfilled Orders | -14.1 | 5.5 | 36.5 | 3.9 | 1.7 | ||
| Inventories | -2.1 | 3.5 | 30.8 | 4.7 | -1.2 | ||
| Prices Paid | 43.9 | 42.1 | 41.8 | 5.7 | 36.5 | ||
| Prices Received | 6.7 | 23.4 | 47.9 | 10.3 | 13.1 | ||
| Number of Employees – Full-Time Permanent | -4.7 | 13.5 | 71.8 | 14.6 | -1.1 | ||
| Number of Employees – Part-Time, Temporary, and Contract | 1.8 | 14.6 | 70.5 | 9.2 | 5.4 | ||
| Average Employee Workweek | -0.5 | 10.7 | 80.3 | 9.0 | 1.7 | ||
| Wage and Benefit Costs | 23.5 | 41.6 | 50.2 | 7.9 | 33.7 | ||
| Capital Expenditures – Physical Plant | -0.2 | 21.4 | 46.6 | 6.9 | 14.5 | ||
| Capital Expenditures – Equipment and Software | 16.3 | 16.5 | 55.7 | 10.4 | 6.0 | ||
| Six Months from Now vs. May | |||||||
|
Previous Diffusion Index |
Increase | No change | Decrease |
Diffusion Index |
|||
| What is your assessment of general business activity for the region? | 6.7 | 24.0 | 37.8 | 33.6 | -9.6 | ||
| What is your assessment of general business activity for your firm? | 7.8 | 40.3 | 32.3 | 26.0 | 14.4 | ||
| Notes: (1) Diffusion indexes represent the percentage of respondents indicating an increase minus the percentage indicating a decrease. (2) All data are seasonally adjusted. (3) Percentages may not sum to 100 because of rounding, omission by respondents, or both. (4) Survey results reflect data received through May 21, 2026. Federal Reserve Bank of Philadelphia Nonmanufacturing Business Outlook Survey Released: May 26, 2026, at 8:30 a.m. ET. |
|||||||