February 2025 Nonmanufacturing Business Outlook Survey
Note: Survey responses were collected from February 10 to February 20.
Nonmanufacturing activity declined this month, according to the firms responding to the February Nonmanufacturing Business Outlook Survey. The indexes for general activity at the firm level, new orders, and sales/revenues all declined into negative territory. The firms continued to report overall increases in full- and part-time employment. The price indexes suggested little change in the prices of firms’ own goods and services this month but continued to indicate overall increases in prices for inputs. Expectations for growth over the next six months were less widespread at the firm and regional levels.
Current Indicators Decline
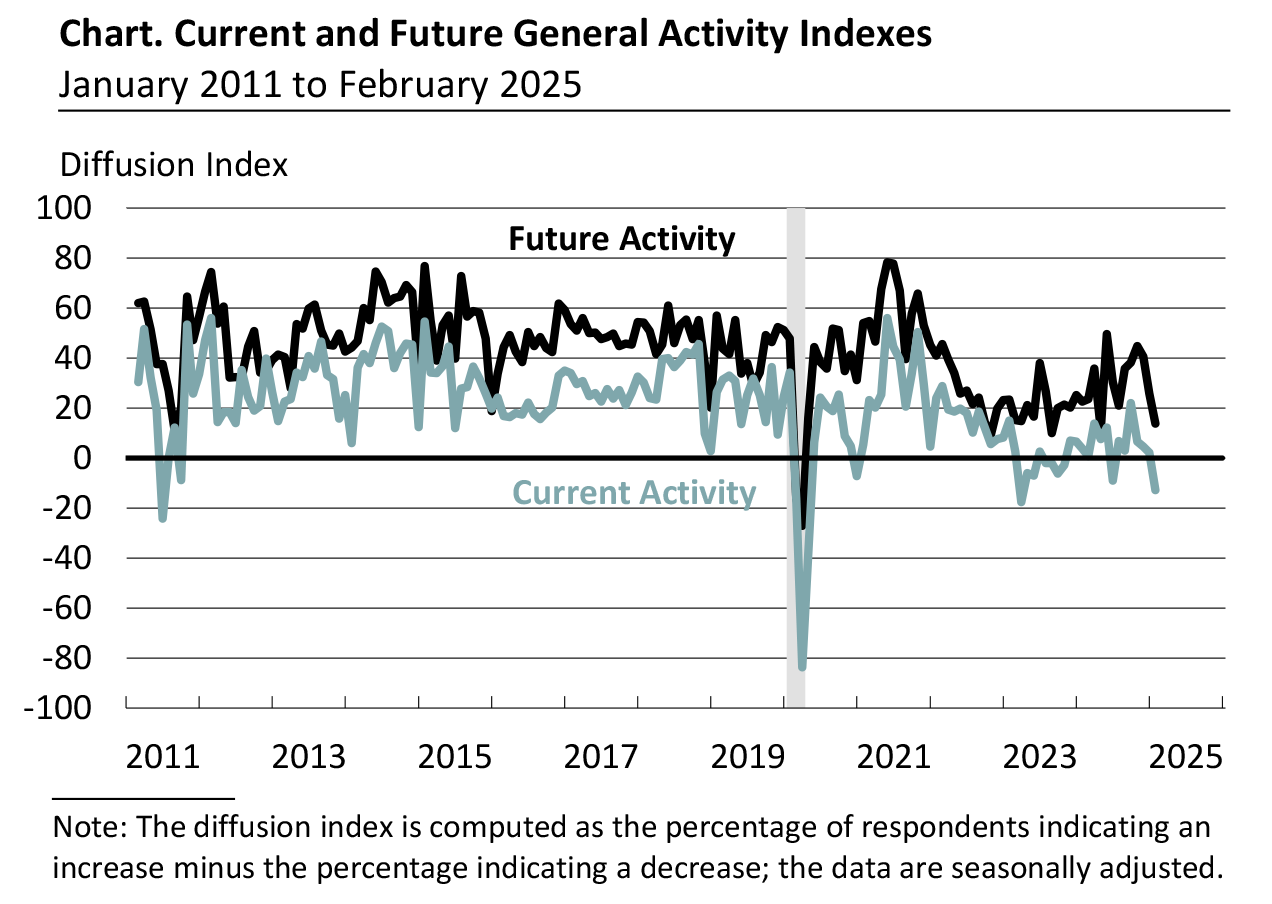
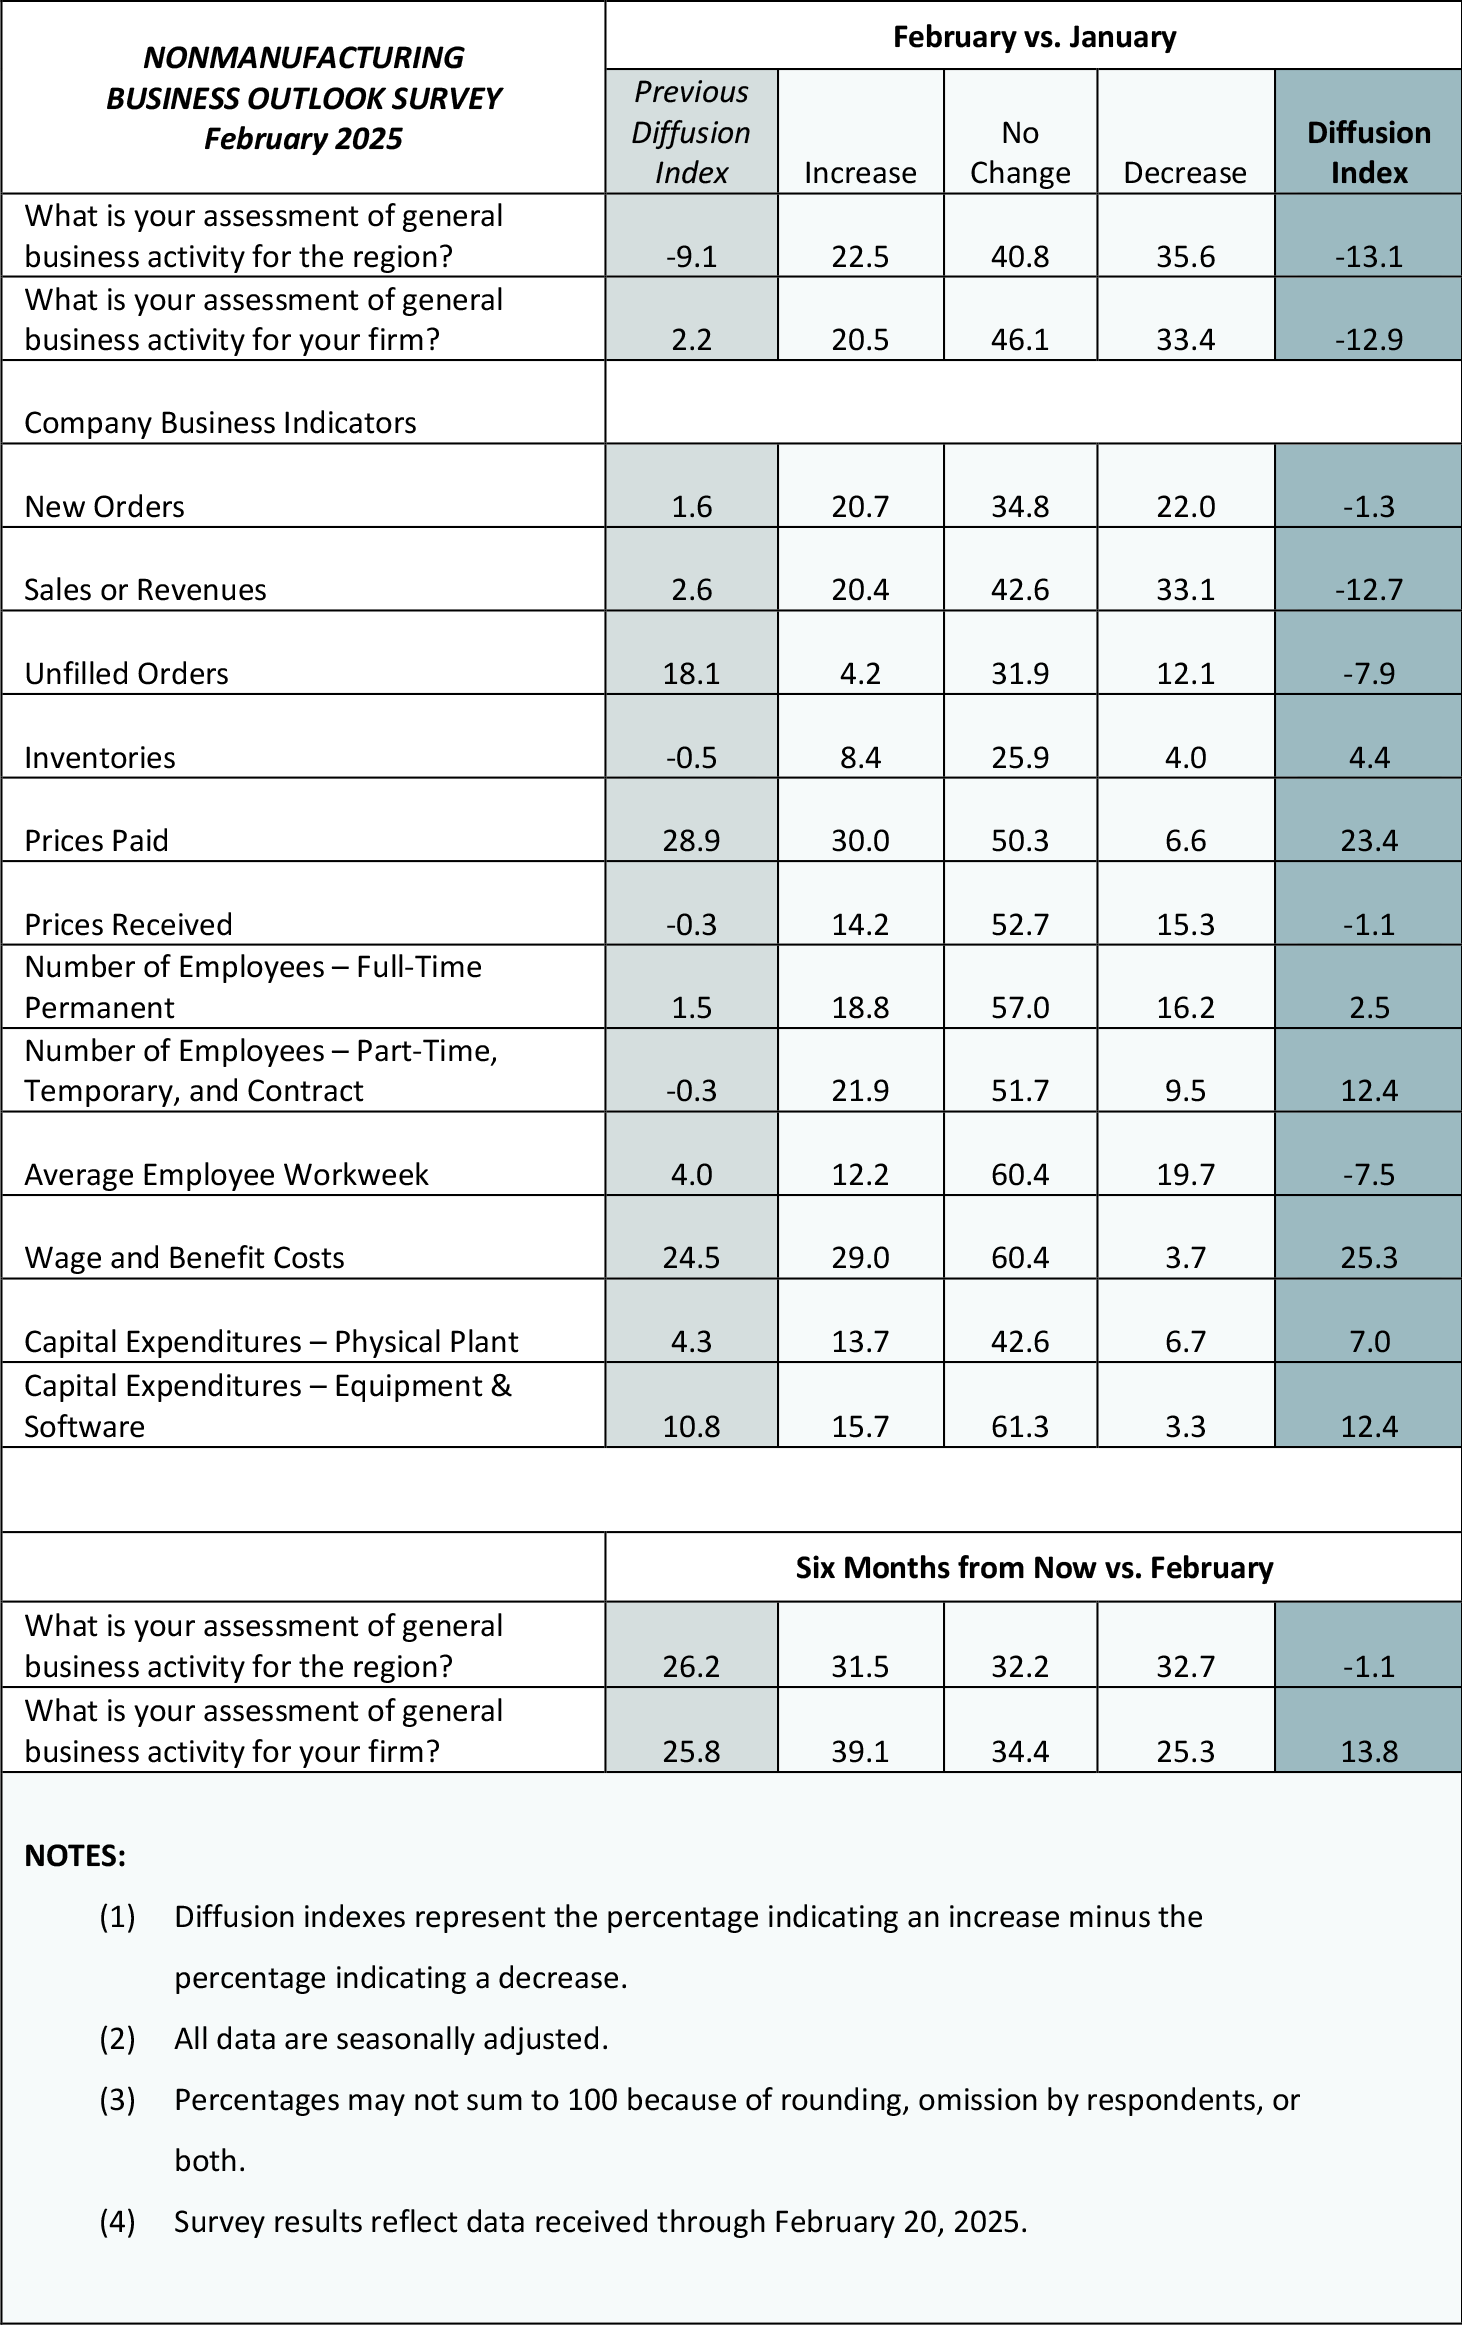
The diffusion index for current general activity at the firm level fell from 2.2 to -12.9 in February, its lowest reading since April 2023 (see Chart). Almost 21 percent of the firms reported increases in activity (down from 29 percent last month), 33 percent reported decreases (up from 27 percent), and 46 percent reported no change (up slightly from 43 percent). The sales/revenues index experienced a similar decline, falling 15 points to -12.7, its lowest reading since May 2020. The new orders index returned to negative territory, decreasing from 1.6 to -1.3. The indicator for current regional activity moved down 4 points to -13.1.
Firms Report Overall Increases in Employment
The full-time employment index ticked up 1 point to 2.5. Nearly 19 percent of the firms reported increases in employment, exceeding the 16 percent that reported decreases. Most firms (57 percent) reported no change. The part-time employment index more than recovered from its decline last month, rising 13 points to 12.4, while the average workweek index fell from 4.0 to -7.5, its first negative reading since April.
Price Indexes Are Below Long-Run Averages
The price indicators suggest increases in prices for inputs but little change in prices for the firms’ own goods and services overall. The prices paid index declined from 28.9 to 23.4 this month. Thirty percent of the firms reported increases in input prices, while 6 percent reported decreases; 50 percent reported steady prices. Regarding prices for the firms’ own goods and services, the prices received index remained slightly negative at -1.1, its lowest reading since June 2023. More than half of the firms (53 percent) reported no change in prices received, while the share of firms reporting decreases (15 percent) edged out the share reporting increases (14 percent).
Firms Expect Own Price Increases to Lag Inflation
In this month’s special questions, the firms were asked to forecast the changes in prices of their own products and for U.S. consumers over the next four quarters. Regarding their own prices, the firms’ median forecast was for an increase of 2.0 percent, down from 2.8 percent when the question was last asked in November. The firms’ reported own price change over the past year was 0.0 percent, down slightly from 0.5 percent last quarter. The firms expect their employee compensation costs (wages plus benefits on a per employee basis) to rise 3.0 percent over the next four quarters, down from 4.0 percent last quarter. When asked about the rate of inflation for U.S. consumers over the next year, the firms’ median forecast moved up from 3.0 percent to 3.3 percent.
Future Indicators Decline
Expectations for growth over the next six months were less widespread, and both future indexes declined for the fourth consecutive month. The diffusion index for future activity at the firm level fell 12 points to 13.8, its lowest reading since May (see Chart). Over 39 percent of the firms expect increases in future activity at their firms (down from 46 percent last month), 25 percent expect decreases (up from 20 percent), and 34 percent expect no change (up slightly from 32 percent). The future regional activity index turned slightly negative, its first negative reading since August.
Summary
Responses to this month’s Nonmanufacturing Business Outlook Survey suggest declines among firms overall in the region. The indicators for firm-level general activity, new orders, and sales/revenues all declined and turned negative. Employment indicators remained positive and suggest overall increases in employment. The firms reported little change in the prices of their own goods and services and increases in prices paid for inputs. The firms continue to expect growth over the next six months at their own firms, but expectations for growth were less widespread.
Special Questions (February 2025)
| Please list the annual percent change with respect to the following: | ||
|---|---|---|
|
|
Current |
Previous (Nov. 2024) |
| For your firm: | ||
| Forecast for next year (2025Q1–2026Q1) | ||
| 1. Prices your firm will receive (for its own goods and services sold). | 2.0 | 2.8 |
| 2. Compensation your firm will pay per employee (for wages and benefits). | 3.0 | 4.0 |
| Last year's price change (2024Q1–2025Q1) | ||
| 3. Prices your firm did receive (for its own goods and services sold) over the last year. | 0.0 | 0.5 |
| For U.S. consumers: | ||
| 4. Prices U.S. consumers will pay for goods and services over the next year. | 3.3 | 3.0 |
| 5. Prices U.S. consumers will pay for goods and services over the next 10 years (2025–2034). | 3.1 | 3.8 |
| The numbers represent medians of the individual forecasts (percent changes). For question 5, firms reported a 10-year annual-average change. | ||
Summary of Returns (February 2025)
Return to the main page for the Nonmanufacturing Business Outlook Survey.