Racially Restrictive Covenants in the City of Philadelphia
Why This Matters
Simply put, explaining the present often requires us to understand the past. We are still seeing the effects today of past discriminatory housing policies and practices.

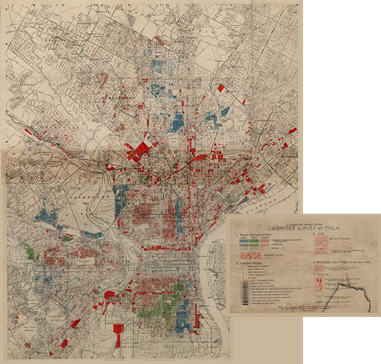
Map excerpts from a 1934 survey of
Philadelphia by J.M. Brewer. The map depicts
concentrations of Jewish, Italian, and Black
("Colored") populations. Brewer later served
as a map consultant to the Home Owners Loan
Corporation. Source: Greater Philadelphia
GeoHistory Network.
In housing, where families remain in the same home or neighborhood for many years, the effects of practices intended to maintain a certain racial composition are visible today. Using data from the 2020 census, researchers found that, 72 years after the use of racial covenants was invalidated, Philadelphia was still the 11th most racially segregated city in the country.1
And sometimes, practices continue even decades after they have been made illegal. Researchers have found evidence of continued involuntary residential segregation in the housing and rental housing markets.
Researchers are just beginning to study the effects that the practice of imposing racial covenants had on people’s choice of housing, their ability to accrue housing wealth, and their education and employment outcomes.
- A recent study found that racial covenants affected present-day home prices and neighborhood racial composition in the Minneapolis area. Such analysis is difficult, requiring the researcher to control for a wide variety of practices that kept non-White individuals from living where they wanted to live, including redlining, steering, and intimidation.
- Research has identified a number of ways in which the neighborhood you live in affects your economic potential (Currie, 2011; Chetty et al., 2016; Chetty et al., 2019).
If there is one metric by which we can better understand the effect that historic policies and practices have had on persons of color, it is the racial wealth gap.
- In 2019, the White-to-Black racial wealth gap was about 6 to 1, meaning that for every $60,000 of wealth held by a White household on average, a Black household had just $10,000 (Derenoncourt et al., 2023).
- In the 50 years following Emancipation in 1865, the racial wealth gap narrowed. Then, starting in the mid-20th century, convergence came to a halt, and the racial wealth gap began to worsen.
- Further, research suggests that differences in wealth-accumulating conditions (e.g., capital gains, rates of return, and savings rates) for Black and White Americans could cause the wealth gap to persist indefinitely or even widen in the future.
Among cities with a population of at least 200,000.
NOTE: The views expressed here do not necessarily reflect the views of the Federal Reserve Bank of Philadelphia or the Federal Reserve System.