Monetary Policy Benchmarks
Frequently Asked Questions
Frequently asked questions about the Monetary Policy Benchmarks explorer.
What is a New Keynesian dynamic stochastic general equilibrium (NK DSGE) model?
An NK DSGE model is a framework that describes how households, businesses, and policymakers interact and make decisions and how those decisions shape the economy over time. NK DSGE stands for New Keynesian Dynamic Stochastic General Equilibrium, with each phrase describing a key feature of the model:
- New Keynesian means that the model adds features such as a gradual adjustment of prices and wages in response to changes in economic conditions meant to make the model more realistic and to allow for monetary policy to have a meaningful role in the economy.
- Dynamic means that it captures that households’ and firms’ economic decisions depend on the past and their expectations of the future.
- Stochastic means that it includes random causes of economic fluctuations (known as shocks), such as unpredictable changes in technology or consumer sentiment.
- General equilibrium means that prices, wages, and interest rates adjust such that supply equals demand for goods, services, labor, and capital, simultaneously.
This type of model is useful for studying short-term fluctuations and the impact of Federal Reserve decisions on inflation, output, and employment.
What is the baseline rule?
The baseline rule describes how the monetary authority in the model (which aims to capture the Fed’s policymaking process) sets the nominal interest rate in response to deviations of inflation from its target and fluctuations in output. For example, if inflation rises above the target, the rule prescribes increasing interest rates; if output growth falls relative to its benchmark level, it suggests lowering rates. The baseline rule serves as the default policy assumption in simulations, providing a benchmark for analyzing alternative policies.
What are the different Taylor rules?
Taylor rules, named after Stanford economist John B. Taylor, are simple mathematical benchmarks that aim to approximate how the Fed conducts policy. The first of these rules is known as the Taylor 1993 rule, and it characterizes how the Federal Reserve systematically adjusts interest rates based on deviations of inflation from the Fed’s inflation target and the output gap (i.e., the difference between actual gross domestic product (GDP) and potential GDP, in real terms). The Taylor 1999 rule is the updated version with a similar structure, but with a stronger response to inflation. The Inertial Taylor 1999 rule adds “interest rate smoothing,” meaning the Fed adjusts rates gradually instead of making a big jump all at once. For technical details about these rules, see the Definitions page.
What makes the baseline forecast uncertain?
Just like in the real world, the households and businesses in the model don’t know when or how big shocks — as sudden changes in technology, consumer preferences, or investment opportunities — will be. Consequently, they make investment and savings decisions under uncertainty, based on their expectations of future economic development. This uncertainty about futures outcomes maps into uncertainty in our forecast that is reflected in the form of probability bands.
What data do you use as inputs into the model? How often do you update the projections?
The model takes as inputs real GDP, labor market indicators (including unemployment and job vacancy rates, and real earnings per worker), consumer spending, business fixed investment, interest rates, inflation, and inflation expectations. The sources for these data include official releases from federal agencies like the Bureau of Economic Analysis and the Bureau of Labor Statistics, and surveys like the Philadelphia Fed’s Survey of Professional Forecasters. These data are updated at a quarterly frequency. For more detailed information on the data, please see the Methodology page.
How can I use the Monetary Policy Benchmarks explorer?
The explorer allows you to compare a range of projected outcomes for key economic variables based on each different monetary policy rule, all starting from the same current state of the economy. The tool shows how each rule would project the path of monetary policy and other outcomes — that is, it models how the federal funds rate and other outcomes such as inflation or the unemployment rate would evolve over time given each rule. The explorer has two tabs, “Explore Model Forecasts” and “Compare with Previous Forecasts.”
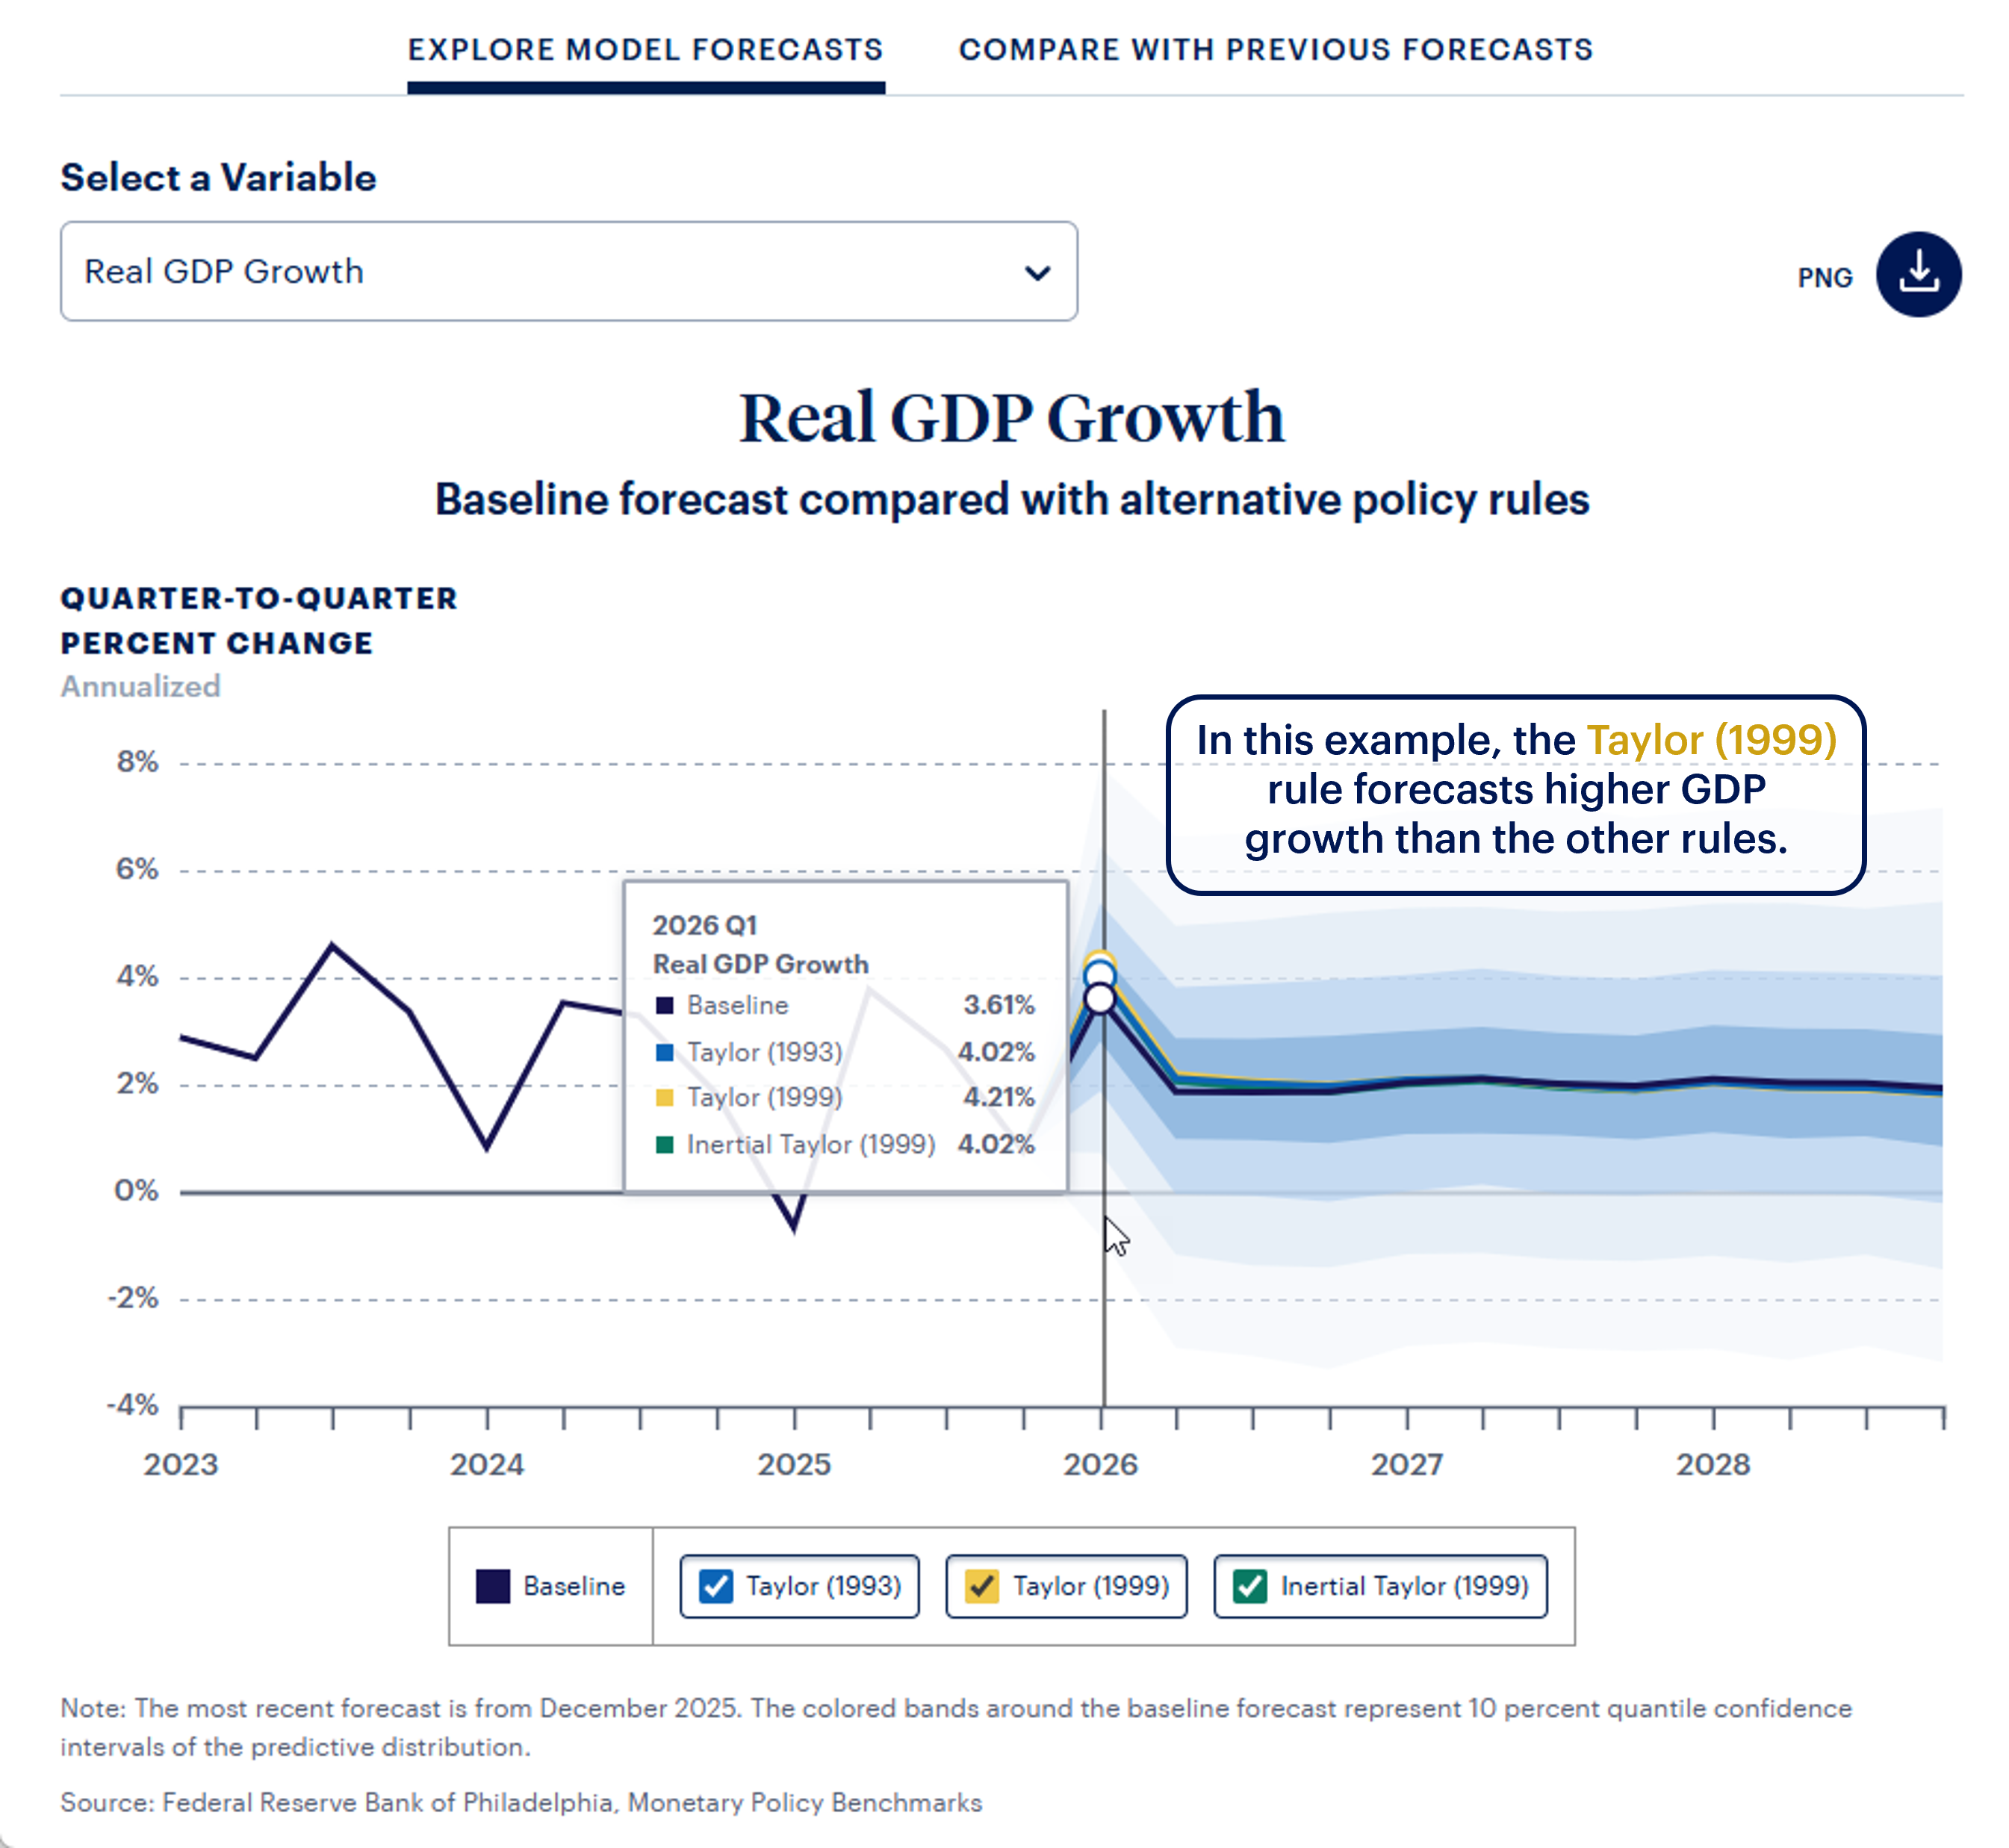
In the “Explore Model Forecasts” tab, how do I interpret a high or low value?
Using “Real GDP Growth” as an example, if one of the Taylor rules has higher values on the line chart, then permanently following that rule is forecast to bring higher GDP in the future than the other rules along with corresponding changes in other outcomes.
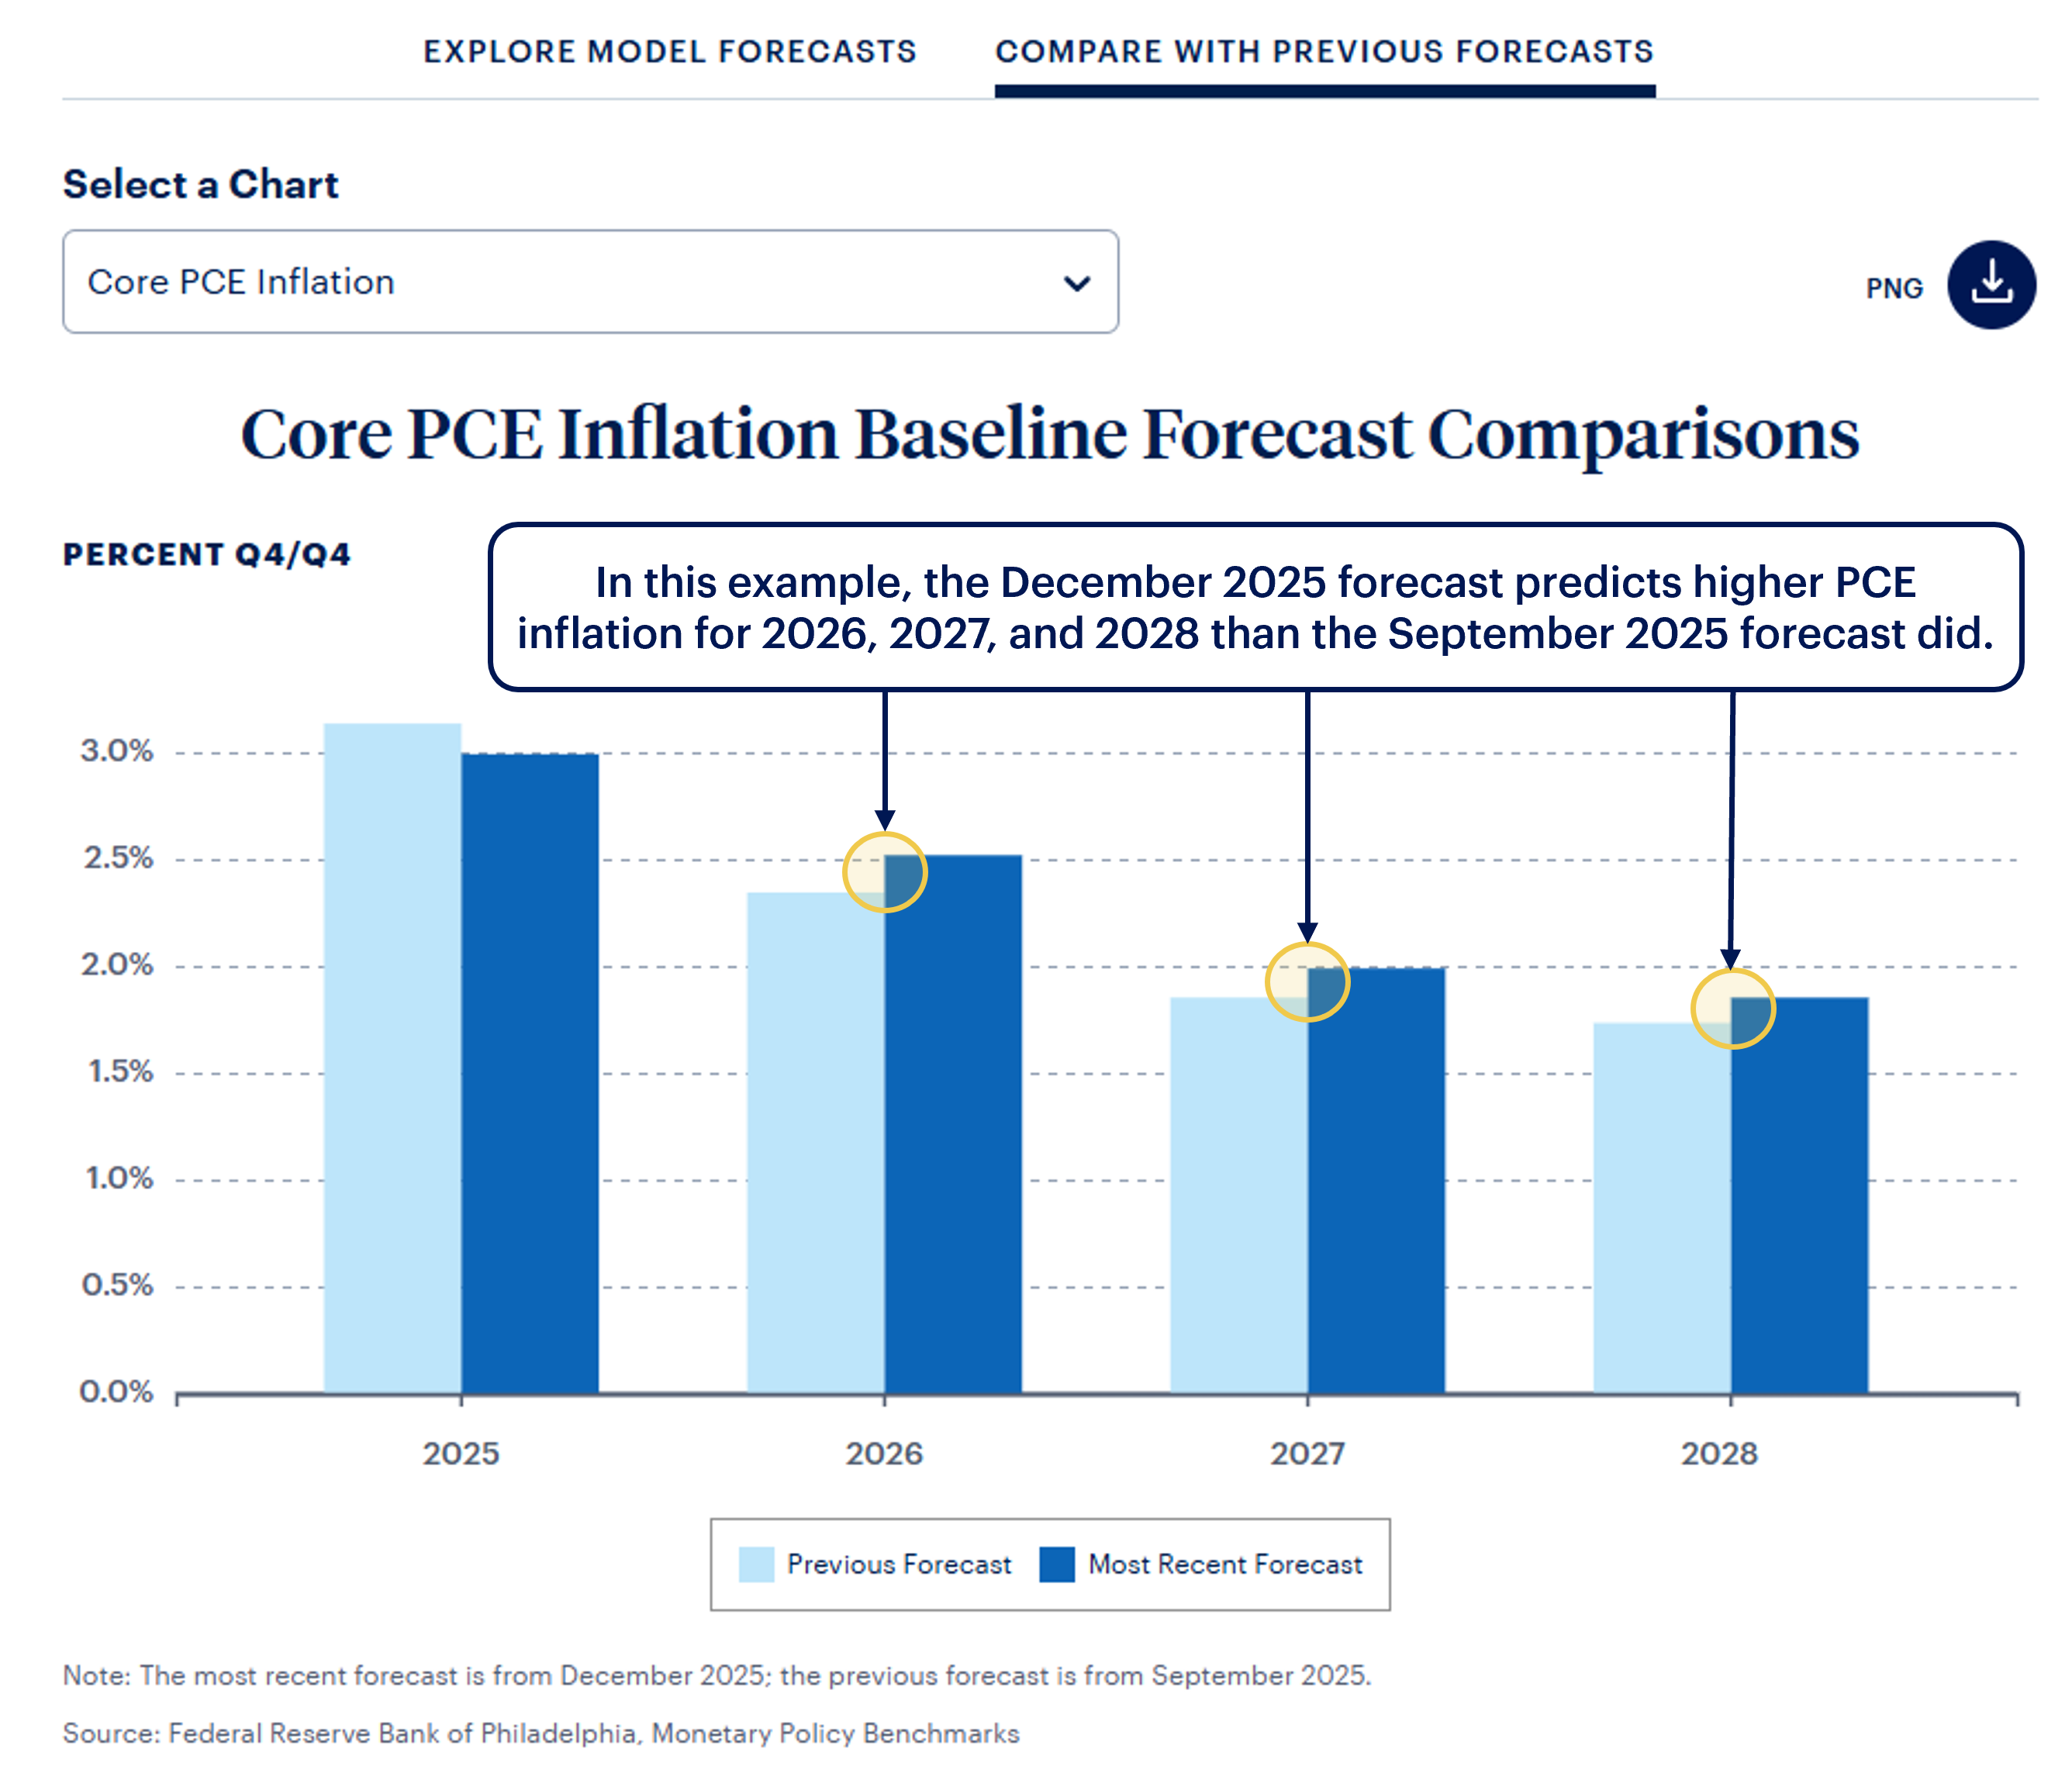
How do I interpret the bars in the “Compare with Previous Forecasts” tab?
An increase from “previous forecast” to “most recent forecast” means that current conditions predict higher GDP (or inflation, unemployment, or federal funds rate, depending on selection) than the last time we published the model.
Can this tool tell me anything about the future of monetary policy?
No. The explorer only displays the projected outcomes for each of the rules and does not predict the actual path of monetary policy.