Anchor Economy Dashboard
Methodology
Methodology for the Anchor Economy Dashboard.
1. Industry Definitions
For the purposes of this study, the following North American Industry Classification System (NAICS) industry codes are used to define the higher education and hospital sectors, respectively:
- Hospitals are defined using NAICS code 622.
- Higher education is defined using NAICS codes 6112 and 6113.
The industry codes selected are consistent with the numerous government data sources that are used throughout this study. It is worth noting that specific industries related to higher education and hospitals are not considered as part of this study, including those industries within the broader health care and social assistance sector (NAICS 62):
- Ambulatory health care services (NAICS 621)
- Offices of physicians
- Offices of dentists
- Offices of other health practitioners
- Nursing and residential care facilities (NAICS 623)
- Social assistance (NAICS 624)
As well as those industries within the broader educational services sector (NAICS 61):
- Elementary and secondary schools (NAICS 6111)
- Business schools and computer and management training (NAICS 6114)
- Technical and trade schools (NAICS 6115)
- Other schools and instruction (NAICS 6116)
- Educational support services (NAICS 6117)
2. Institutional Data
The 2024 data excludes certain “institutional” data from the American Hospital Associations (AHA) and the Integrated Postsecondary Education Data System (IPEDS), which were not used in the economic impact analysis (e.g., number of hospital beds, which came from the American Hospital Association). Data from IPEDS are still used to estimate the employment for state government–owned colleges in six MSAs where the IMPLAN imputation was poor quality. See below for further details on these metros.
QCEW
The number of establishments in higher education (NAICS 6112 and 6113) and in hospitals (NAICS 622) are reported based on QCEW establishment counts. This sums the number of institutions regardless of ownership (i.e., including both private and local, state, and national government–owned establishments), which corresponds to the establishments whose activity is modeled in the economic modeling work described in section 3. Establishment counts are based on county-level data, which are summed to obtain regional totals for MSA and non-MSA regions.1 Establishment counts are used in the modeling for economic impact but are not reported separately in the Anchor Economy Dashboard, as they include offices and locations that may be purely administrative in nature and not patient- or student-facing.
In California, institution counts from the QCEW for both hospitals and colleges proved unreliable. For this reason, for California regions, the higher education establishment count is derived from the count of IPEDS postsecondary educational institutions, and the hospital establishment count is derived from the count of AHA community hospitals.
Note that the QCEW is only used as the direct source for the establishment count variables (outside of California). We note that direct employment and labor income impacts are analogous to the employment and wage variables in the QCEW,2 summed across geography (counties) and ownership (private/government) categories. (That is, direct employment represents workers at the institutions themselves, which is what is reported in QCEW.) However, the original QCEW data have a large number of missing values for these variables because of data suppressions by the Census. (The establishment counts described above are not suppressed.) IMPLAN uses these QCEW values as a major input into its estimates of employment and labor income by county and industry, along with other government data sources, and so effectively estimates values for suppressed data in the QCEW. We thus use the IMPLAN estimates for the four variables of higher ed employment, higher ed income, hospital employment and hospital income, rather than the raw QCEW data with suppressions. This approach matches that of the 2019 and 2004 work.
3. Economic Impact Modeling
Two sources of economic impacts are calculated in the economic impact modeling:
- The operational activity (operational spend) of hospitals and colleges. This includes the compensation of employees, capital income to business owners, certain directly paid taxes (taxes on production and imports), and the full impact from supply chain spending. (Section 3.1)
- Impacts from capital expenditures (capital spend) associated with hospitals and colleges. (Section 3.2)
In 2024, we excluded “ancillary spending” impacts from the model, which captured the spending by visitors to hospitals and colleges, given that the impacts of ancillary spending were minimal compared to operational and capital expenditure impacts.
The inputs were run through the IMPLAN system for the 520 regions to calculate, for each type of impact and the three channels of impact. These three channels of impact are standard for input-output economic impact analysis and are represented in Figure 1.
- Direct impacts, representing the economic activity at the institutions themselves;
- Indirect impacts, representing the full supply chain impact; and
- Induced impacts, representing the economic activity supported by spending of direct and indirect workers out of wages.
Note that each of the three channels of impact can be disaggregated between eds and meds. Thus, one might consider the indirect employment impact of educational institutions, or the induced impact of GDP of hospitals, for example. Section 4 discusses how these various results are presented in the dashboard.
Figure 1. Summary of the Channels of Economic Impact
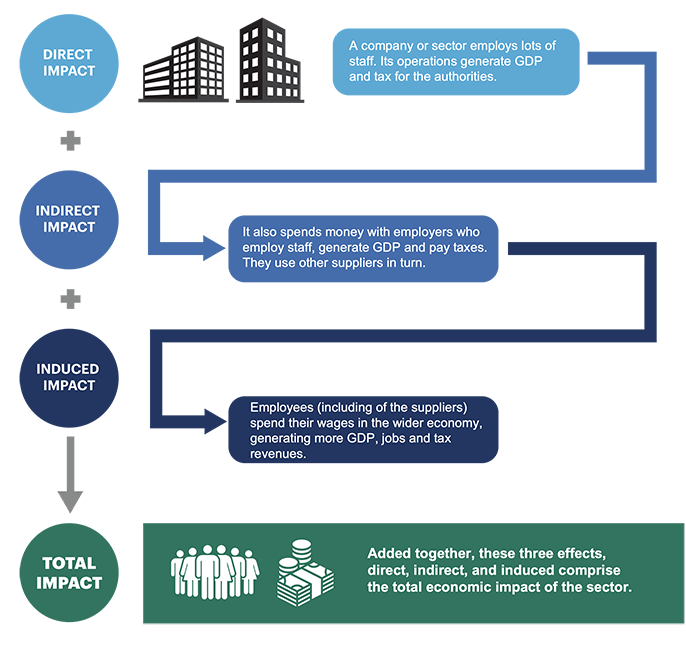
Direct effects: The first group of impacts to be assessed is the economic activity associated with the eds and meds U.S. operations. This is defined as the activity supported by the direct employment and sales of the industries.
Indirect (supply chain) effects: This type of impact identifies linkages between eds and meds and the sectors’ respective supply chains. As a result of purchasing goods and services from suppliers, economic value is created beyond the direct operations of the sector. This includes, for example, jobs supported in a wide variety of activity in publishing, medical equipment manufacturing, and business services sectors (IT, accounting, auditing, etc.). Of critical importance when estimating multipliers is to consider leakage. This concept captures the fact that some purchases will be made outside the region (or even country) and do not add to regional output or employment.
Induced (workers’ spending) effects: The induced impact captures economic activity supported by those directly or indirectly employed by eds and meds who spend their disposable income on goods and services in the regional economy. This helps support jobs in the industries that supply goods and services to consumers, including jobs in retail outlets, restaurants, and a range of other service industries. This is also estimated in terms of regional gross domestic product (GDP) and employment.
How the Channels of Impact Are Measured
The channels of impact (direct, indirect, and induced) are quantified across three primary measures: employment, income, and gross domestic product (GDP) . Each category is defined below, and the impacts are calculated across each of the aforementioned channels for each of the 546 IMPLAN industries. The results of the contribution analysis are presented as the summed total of all 546 industries.
Employment: An industry-specific mix of full-time, part-time, and seasonal employment. An annual average that accounts for seasonality and follows the same definition used by the Bureau of Labor Statistics (BLS) and the Bureau of Economic Analysis (BEA). IMPLAN employment is not equal to full-time equivalents.
Income (Labor income): All forms of employment income, including employee compensation (wages and benefits) and proprietor income.
Gross Domestic Product (GDP): A measure of output-less intermediate consumption that represents an industry’s contribution to GDP. It is the measure of the value of goods and services produced in a specified region. The first iteration of the Anchor Economy Dashboard referred to this same measure as gross value added, which is a slightly narrower measure of economic output that excludes certain direct taxes. Because IMPLAN includes these relevant taxes, we opted to use gross domestic product in this iteration, given its familiarity.
3.1 Operational Spend (“opex”)
Operational impacts were calculated for both of the two industry categories (eds and meds) and for four ownership categories (private institutions, as well as local, state, and federal government). For private and state and local government-owned institutions, the scale of the impact is determined as a share of the relevant IMPLAN industry. For federal government-owned institutions, QCEW data are used instead.3
The table below presents the sources for each of the categories. For privately-owned colleges and hospitals, the share of the underlying IMPLAN industries used in the impact analysis is 100% (prior to the year adjustments described in 2.1.2 below). For state and local government owned hospitals and colleges, the share of the IMPLAN industry included in the impacts is estimated using data from the Annual Survey of State and Local Government Finances (ASSLGF). For education, this share is the percentage of total state or local educational spending that goes to higher educational institutions (as opposed to primary and secondary schools). For hospitals, the share is the percentage of state or local healthcare spending that goes to hospitals (as opposed to other types of public health spending). For federal government owned hospitals and colleges, the impacts are estimated based on the employment and employee compensation at federally owned hospitals in the QCEW data.4
| Eds/meds | Ownership | IMPLAN industry |
IMPLAN industry title | Impact amount |
|---|---|---|---|---|
| Eds | Private | 463 | College & universities | 100% of IMPLAN ind. |
| Eds | State government | 521 | State government, education | Share of IMPLAN ind. based on ASSLGF |
| Eds | Local government | 524 | Local government, education | Share of IMPLAN ind. based on ASSLGF |
| Eds | Federal government | 528 | Federal government, non-military | Employment & employee compensation of federally owned hospitals in QCEW |
| Meds | Private | 472 | Hospitals | 100% of IMPLAN ind. |
| Meds | State government | 522 | State government, hospitals and health services | Share of IMPLAN ind. based on ASSLGF |
| Meds | Local government | 525 | Local government, hospitals and health services | Share of IMPLAN ind. based on ASSLGF |
| Meds | Federal government | 528 | Federal government, non-military | Employment & employee compensation of federally-owned hospitals in QCEW |
Special Inputs for State Schools in Six MSAs
As in the 2019 and 2004 work, the standard input for state government–owned colleges, described above, was overridden for six specific MSAs in which the IMPLAN imputation of suppressed QCEW employment in this industry and ownership category appears to have been of poor quality. In these six MSAs, data from IPEDS are used instead to estimate the employment for state government–owned colleges. These six MSAs are:
| Region | State College |
|---|---|
| State College, PA | Penn State University |
| Corvallis, OR | Oregon State University |
| Lawrence, KS | University of Kansas |
| Champaign-Urbana, IL | University of Illinois |
| Blacksburg-Christiansburg-Radford, VA | Virginia Tech (State University) |
| Harrisonburg, VA | James Madison University |
3.2 Capital Spending Impacts (“capex”)
As in the 2019 and 2004 work, capital spending impacts were estimated separately in a single national model and distributed between the regions proportionally to their direct operational employment impacts. This was done separately for eds and meds based on the IMPLAN operational modeling described above.
The source for the capital spending assumptions is the BEA Investment in Fixed Assets data by industry.5 Investment data for the education sector (6100) and for hospitals (622H) were aligned to IMPLAN categories to estimate the national level impact. Because educational investment is not available separately for institutions of higher education, the capital expenditure for this sector was scaled to (private) educational higher institutions’ share of this sector based on IMPLAN data (53.7%).
Because the BEA capex expenditures only cover privately owned institutions, additional capex impact was allocated for government owned institutions using the same ratio of capex impacts to direct employment estimated for private institutions.
4. Location Quotients, Reliance Scores, and Multipliers
IMPLAN data for each of the 520 regions were used to calculate the location quotients (LQs) for the employment, GDP, and labor income impacts. LQs are defined as the ratio of the relevant impact to the total employment, GDP, or labor income for the relevant region divided by the analogous ratio for the United States as a whole. For example, if the total employment impact in a particular region represents 6 percent of employment in the region, and nationally the employment impact is 4 percent of national employment, the employment LQ would be 1.5 (= 6% / 4%).
The reliance score Is defined for this work as the average of the three LQs.
Multipliers for employment and labor income are also provided and are defined as the ratio of the total impact (measured in employment or labor income) divided by the direct impact. In the original version of the 2019 Anchor Economy Dashboard, the multipliers were defined instead as the ratio of the total impact to the direct impact only for the opex activity — i.e., excluding capex and ancillary impacts in the denominator. These multipliers have been adjusted in the 2019 data set, and this change is noted again below in “Adjustments to Data from Previous Years.”
5. Dollar Year Adjustments
All dollar amounts displayed in the dashboard data have been inflation-adjusted to 2024 dollars. Results are adjusted to 2024 dollars in the 2004 and 2019 data using industry-specific adjustment factors provided by IMPLAN. Dollar values for GDP and labor income were adjusted in the original 2004 and 2019 detailed modeling results for each of the 546 IMPLAN industries.
6. Adjustments to the 2019 Results
The following adjustments have been made to the dashboard as of May 2026:
- Ancillary impacts were excluded from the economic impact analysis. These impacts were intended to capture spending by visitors to educational and medical institutions, but (given the assumptions made) were very small in magnitude relative to the operational and capital expenditure impacts.
- The 2024 update provides data on the direct, indirect, and induced impacts of higher education institutions and hospitals separately so users can see the respective economic contributions of these institutions in their region. Due to the focus on the economic impact analysis, we decided to exclude certain “institutional” variables derived from other sources (e.g., number of hospital beds, which came from the American Hospital Association).
- While operational and capital expenditures remain outputs of the economic impact modeling, these values are no longer included in the regional profiles or the downloadable data on the dashboard. We chose to exclude these values and include separate higher education and hospital direct, indirect, and induced impacts for each measure instead, finding that these values are more easily interpretable.
- The 2024 data uses the most recent MSA definitions from the OMB Bulletin released in 2023, whereas the 2004 and 2019 data uses definitions from 2018.
- Given changes in the MSA definitions between the 2024 data and data from previous years, we have removed all change data from the profiles and data downloads. Regions in the 2004 and 2019 remain the same. Please refer to the variable ‘matches_2024’ in the 2004 and 2019 data downloads before comparing regional impacts over time to see whether a region’s geography is consistent between data years.
7. Variable Description and Source
The Data Dictionary tab of the downloadable data file outlines all metrics provided in the Anchor Economy Dashboard, including the channel of impact they represent (direct, indirect, induced, or total) and the measure they capture (income, employment, or GDP). In the downloadable data, variables for 2004, 2019, and 2024 are divided into separate worksheets. Separate eds and meds impacts are only available in the 2004 and 2024 data.
8. U.S. Regions Reported in the Anchor Economy Dashboard
Data and the reliance index in the Anchor Economy Dashboard are at the metro/nonmetro regional level as defined by the BLS. A definition of regions for the 2024 data can be found here. See here for a definition of regions for the 2019 and 2004 data.
The only exception to the above was in the state of Connecticut, where Planning Districts have recently replaced counties in the government’s MSA definitions. Because IMPLAN does not yet support Connecticut Planning Districts, we used the legacy definition of Connecticut MSAs from the previous work.6
The 2024 anchor data use area definitions based on the OMB’s Bulletin No.23-01, dated July 21, 2023. The regions in the 2004 and 2019 use area definitions from the 2018 Bulletin. As a result, many regions saw changes in their geographic boundaries shifts, and data from 2024 may not be directly comparable to the 2004 and 2019 data. Refer to the variable ‘matches_2024’ in the 2019 and 2004 data downloads to determine whether a region has changed in the 2024 data. Geographic boundaries remain consistent across the 2004 and 2019 data.
The QCEW also provides direct totals for privately owned establishments by MSA; however, because we are interested in government-owned establishments as well as non-MSA regions, it was necessary to sum the county-level data. Note that the county-summed establishment count for privately owned establishments does not perfectly match the MSA-level totals but is typically close (within one or two establishments).
Labor income from IMPLAN, however, is more inclusive than wages in the QCEW, and it includes both the value of nonwage compensation like benefits as well as self-employment income.
QCEW data are subject to suppressions for non-federally owned establishments. A key advantage of using IMPLAN data, which combines data from several different underlying government surveys including the QCEW, is that IMPLAN has already performed key data cleaning and imputation tasks.
Consistent with the 2019 and 2004 work, MSAs that cross state boundaries use mean value (weighted by number of counties in each state) of the state-level ASSLGF-derived shares across the different states. Where a region has 0 establishments in the relevant industry and ownership category in the 2024 QCEW, these ASSLGF-derived shares are suppressed and a value of 0 is used instead for the relevant category.
See the non-residential detailed estimates for investment: https://apps.bea.gov/national/FA2004/Details/Index.htm.
The exception is Windham County, CT, which was previously part of the Worcester, MA metropolitan area, but no longer is. Windham County was therefore added to the Connecticut non-MSA region.