

Focusing specifically on loans to businesses with gross annual revenues of $1 million or less, lending in the U.S. over the past 10 years peaked in 2007, had fallen by more than half by 2010, and had risen by 15 percent from this trough by 2013. For the 60 counties in the Third District, total loan volume recovered more robustly between 2010 and 2013 (19 percent), but as the map shows, the recovery was uneven. In some counties, lending to small businesses continued to fall during this period, while in others, particularly those around Philadelphia and in northeastern Pennsylvania, this portion of small business lending increased by more than 30 percent.
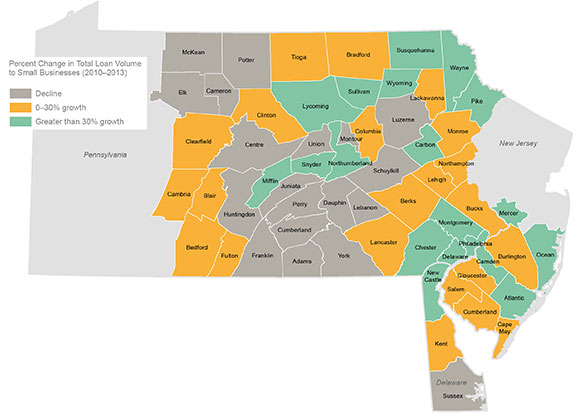
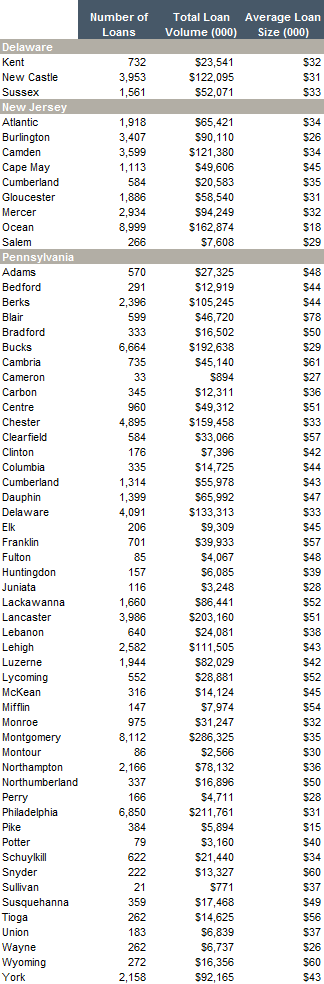
Small businesses in Ocean County, NJ, attracted more loans in 2013 than did small businesses in any other county in the Third District. Small businesses in Montgomery County, PA, claimed the greatest loan volume, while the average loan size was highest in Blair County, PA.
Loans to Businesses with Gross Annual Revenues of $1 Million or Less (2013)
The views expressed here do not necessarily represent the views of the Federal Reserve Bank of Philadelphia or the Federal Reserve System.
Note: For this analysis, small businesses are defined as those with gross annual revenues of $1 million or less. This analysis includes loan originations but excludes loan purchases and lending to small farms. This analysis also excludes small business loans (up to $1 million) if the business had gross annual revenues over $1 million.
Sources: FFIEC, CRA National Aggregate Report, Table 1, 2004-2013; author's calculations using FFIEC's 2010 and 2013 CRA Aggregate Flat Files, Table A1-1; Esri, derived from Tele Atlas; U.S. Census Bureau