

TOD can reduce automobile dependency and make a community more amenable to walking and biking. More recently, equitable TOD (ETOD) has been advocated in response to the gentrification pressures that modern TODs often introduce, displacing the very people most reliant on transit out of the station area. Transportation equity is a relatively new concept to the affordable housing community. The importance of access to transportation has been acknowledged, but it has either been seen as an issue secondary in importance to housing availability or as too large and opaque to address. Recent research1 has shown that transportation equity can no longer be ignored and should receive nearly equal consideration as the availability of affordable housing. Fortunately, ETOD can be demystified, and success can be achieved in communities large and small, urban and suburban.
After housing costs, getting to and from one’s home is the second-largest household expense.2 Depending on the location, transportation costs can vary widely, perhaps more widely than housing costs themselves, for those in subsidized housing. Harvard’s landmark Equality of Opportunity Project, designed to determine the impact of economic mobility, determined that access to affordable, convenient transportation choices is the top determinant of a household’s ability to escape poverty.3 Put simply, the longer it takes to reach life-improving opportunities, the worse the outcome. To reduce this gap, many are forced to buy a car because transit, if available, cannot be relied on, or life needs are too far away or too dangerous to walk to. This in turn increases a household’s annual transportation costs by an average of $8,400 per car (more in the Northeast),4 saddling low- and moderate-income households with transportation burdens that they can barely afford — or not afford at all. Data analysis can now visualize this graphically. The Center for Neighborhood Technology maintains the Housing and Transportation Index,5 which calculates the combined housing and transportation costs for most locations in the United States. In many locations, over half of a household’s income is consumed by housing and transportation costs. The cost of getting to and from a home for some low- and middle-income (LMI) renters and homeowners now rivals the cost of the home itself, especially in medium-sized and small cities, putting homeownership in jeopardy.6
Transportation and Housing Affordability
Transportation costs significantly affect housing affordability. The Center for Neighborhood Technology (CNT), which assists communities in implementing transit-oriented development strategies and addressing other community development needs, has developed data tools and analyses that calculate communities’ transportation costs and transit performance scores (TPS). Each TPS indicates public transit access and frequency, distance traveled, and walkability.
The following pie charts use transportation costs from CNT’s Housing and Transportation Affordability Index and TPS data from CNT’s AllTransit tool.7
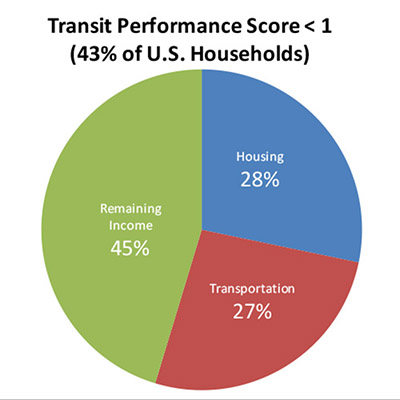
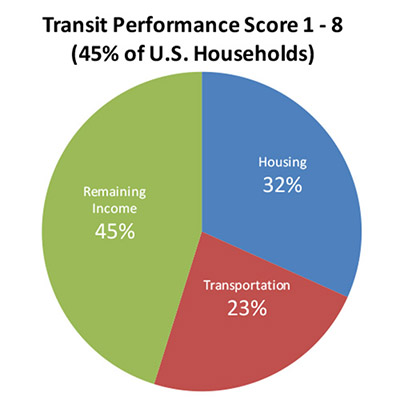
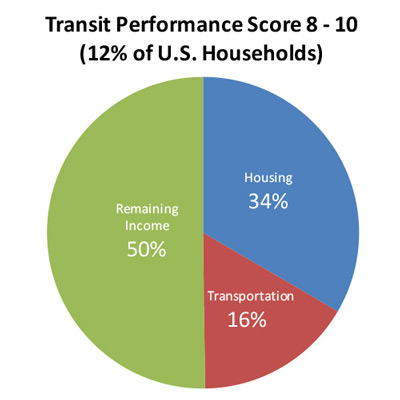
The pie charts highlight several points:
- In the first, 50 million households have a Transit Performance Score (TPS) of less than 1 on a scale of 1–10, and they spend an average of 27 percent of household income on transportation.
- In the second, 53 million households have a TPS of between 1 and 8, and they spend an average of 23 percent of income on transportation.
- In the third, 14 million households have a TPS of between 8 and 10, and they spend 16 percent of income on transportation.
CNT also analyzed data to determine how many U.S. households on average spend less than 10 percent of income on transportation. Only 2,089 block groups met this criteria — roughly 1 percent of all block groups in the U.S., or 1.45 million households.
In the Third Federal Reserve District, CNT highlighted the costs and scores for several example cities:
| Average Annual Transportation Costs |
Transit Performance Score |
|
|---|---|---|
| Allentown, PA | $10,631 | 5.7 |
| Philadelphia | $9,520 | 9.0 |
| Princeton, NJ | $13,297 | 4.6 |
| Wilmington, DE | $10,072 | 7.2 |
For further information, contact Scott Bernstein, Founder and Chief Strategy & Innovation Officer, Center for Neighborhood Technology, at 773-269-4035 or scott@cnt.org; www.cnt.org.
Replacing transit with transportation when discussing ETOD opens the discussion beyond big systems in large cities, bringing in aspects like on-street bus service, paratransit, sidewalks, biking, and compact development in all places, big and small. Transit equity and true home affordability require city housing and planning officials and developers to take this wider approach to ETOD and to rethink affordable housing delivery and siting, prioritizing its creation in such locations. Street design and the way streets connect to various amenities become more important as part of ETOD, emphasizing the ease and speed at which one can travel without a car on those streets to school, health care, the store, and other necessities. Understanding how the transit system works — where it goes, how frequently, and for what duration of the day — is critical to direct development at locations where these criteria best enable residents to access daily living needs. Further, ETOD efforts should consider the experience of getting to and from the bus and waiting for it, and unrealistic parking requirements should be removed from affordable housing developments in favor of transit access.
Although these considerations add another layer of effort, the goals are achievable, and the outcome for tenants can be significant. Expanding ETOD’s definition makes delivering services easier, especially for smaller communities. Marrying transportation equity with affordable housing is more manageable there than in larger areas.
Like affordable housing, implementing transportation equity requires the formation of partnerships and the education of stakeholders, both public and private. Developers and communities wishing to marry transportation equity with home affordability should begin asking new questions of the cities and towns with which they work. These could include questions like how does the city works with its transit agency? Where are the major destinations, and does transit go there? If not, are they accessible by foot? Does the city have a transportation plan, and what tools do officials use to make sure the streets are walkable? If we build in walkable, transit-rich areas, can we reduce our parking requirements? Much of this investigation will result in applying existing techniques to a different set of problems and solutions. Earnest attempts should be made to introduce mixed-use development by marrying housing goals to a city’s economic development goals and collaborating to make streets safer and more appealing for people to use them for walking, biking, or getting to buses or train stations. The local transit authority, if one exists, could be an ally in understanding what routes are most successful and sustainable. Fostering partnerships between the transit agency and regional planning boards, known as metropolitan planning organizations (MPOs) or rural planning organizations (RPOs), can help advance these goals. This process leads to projects that are more transit accessible, but also more walkable and less auto reliant.
Beyond the transit agency, partnerships with regional institutions like hospitals and universities could create benefits as well. Getting familiar with the state department of transportation regional office, regional planning body, and the broader transportation engineering community can help change projects and mindsets. This familiarity could be particularly important because, among other things, it can open up new sources of funding to support goals. Additionally, the federal government and state departments of transportation have programs that provide funding for improving nonauto transportation access.
In Pennsylvania, several smaller communities are already implementing principles of ETOD. Greensburg, a city of about 14,000 residents 30 miles outside Pittsburgh, has created what it terms a health care overlay district that is anchored by a regional hospital, several higher education institutions, a bus depot, and an Amtrak station. Community leaders have developed pedestrian and bicycle plans, made zoning changes, and created an affordable housing fund that is part of a tax abatement program. Since 2008, over $80 million has been invested in the city, including new housing and businesses. Although not an intentional attempt to achieve ETOD, planning and partnerships have helped a city in which 13 percent of the population is below the poverty line to provide affordable housing and to have a balance of transportation options.

Twenty-eight housing units were developed across the street from the Greensburg, PA, train station in the city’s downtown arts district. The Greensburg Community Development Corporation secured options on five parcels and transferred the parcels to Greensburg Property Partners, LLC. The units were constructed in 2015 and occupied in early 2016 by students and professionals.
Photo Credit: Greensburg Property Partners, LLC.
In State College, PA, in Centre County, the Centre Area Transit Authority (CATA)8 has built a network of consulting engineers, municipal staffs, planning commission members, and local elected officials that jointly review network development proposals with the goal of preserving or improving access to transit. CATA shares the cost of a transportation planner with the regional planning body, the Centre County MPO. CATA has sought improvements for pedestrians and integration of transit facilities with other amenities, and even without special zoning, the authority has succeeded.
Although ETOD was not formally at the core of their goals, Greensburg and Centre County have demonstrated what is possible when taking an approach to development that is more location focused and not car based. A more comprehensive, equitable housing development strategy that includes transit and a broad range of transportation alternatives best serves LMI residents.
The views expressed here do not necessarily represent the views of the Federal Reserve Bank of Philadelphia or the Federal Reserve System.
[1]OECD (2016), “Making Cities Work for All: Data and Actions for Inclusive Growth,” OECD Publishing, Paris, available at http://dx.doi.org/10.1787/9789264263260-en
Robert Hickey, Jeffrey Lubell, Peter Haas, and Stephanie Morse, “Losing Ground: The Struggle of Moderate-Income Households to Afford the Rising Costs of Housing and Transportation,” Center for Neighborhood Technology, Center for Housing Policy, October 2012. http://www.cnt.org/sites/default/files/publications/CNT_LosingGround.pdf
HUD Location Affordability Portal: http://www.locationaffordability.info/About.aspx.
[2]“Transportation and Housing Costs.” Federal Highway Administration, U.S. Department of Transportation, available at https://www.fhwa.dot.gov/livability/fact_sheets/transandhousing.pdf.
[3]Raj Chetty and Nathaniel Hendren, “The Impacts of Neighborhoods on Intergenerational Mobility: Childhood Exposure Effects and County-Level Estimates,” Harvard University Working Paper (May 2015), available at http://www.equality-of-opportunity.org/images/nbhds_paper.pdf,
and Sarah Jo Peterson, “What the Equality of Opportunity Project Actually Says About Commuting,” Streetsblog USA, October 10, 2016, available at http://usa.streetsblog.org/2016/10/10/what-the-equality-of-opportunity-project-actually-says-about-commuting/.
[4]Erin Stepp, “Your Driving Costs,” American Automobile Association, August 23, 2017, available at http://newsroom.aaa.com/auto/your-driving-costs/.
[5]See https://htaindex.cnt.org/map/.
[6]Joint Center for Housing Studies of Harvard University, America’s Rental Housing—Expanding Options For Diverse and Growing Demand, 2015, available at http://www.jchs.harvard.edu/sites/jchs.harvard.edu/files/americas_rental_housing_2015_web.pdf; The Center for Neighborhood Technology, Safe, Decent, and Affordable: The Transportation Costs of Affordable Housing in the Chicago Region, January 2012, available at http://www.cnt.org/sites/default/files/publications/CNT_SDA.pdf.
[7]CNT’s Housing and Transportation Affordability Index was updated August 2017 using 2011–2015 American Community Survey Five-Year Data at the census block group level. TPS were derived from CNT’s AllTransit tool, which was updated in August 2017 using schedule data from the General Transit Feed Specification and transit operator information. TPS take into account local and regional connectivity and frequency of service for all fixed-route and scheduled transit service in the U.S. The methods used to calculate the TPS are described in http://alltransit.cnt.org/methods/AllTransit-Methods.pdf.
[8]Hugh Mose, “Guest Post: Transit Oriented Development on a Small-Town Scale,” Human Transit, September 15, 2016, available at http://humantransit.org/2016/09/guest-post-transit-oriented-development-on-a-small-town-scale.html.