

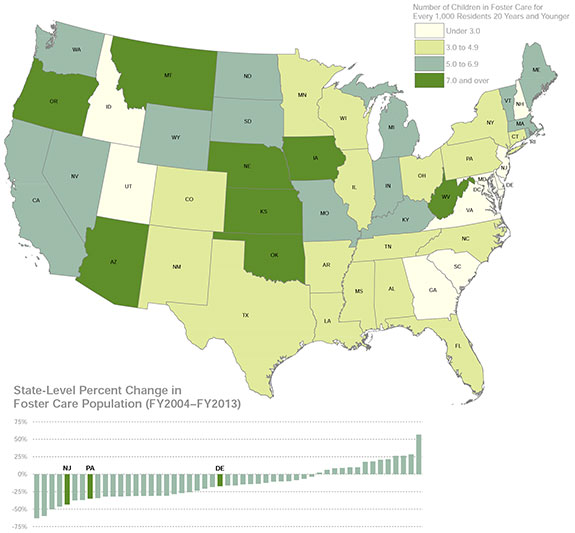
To put this figure in context, this represented roughly 4.6 children in foster care for every 1,000 individuals in the U.S. age 20 or younger. As the map indicates, this ratio varied widely from state to state, with a low of 1.9 in Virginia and a high of 9.5 in neighboring West Virginia.1
Nationwide between fiscal years 2004 and 2013, the foster care population fell by more than 20 percent. Thirty-six states and the District of Columbia registered declines over this period, while 14 states reported an increase. The foster care population fell in all three Third District states: to 14,300 in Pennsylvania (-35 percent); to 6,900 in New Jersey (-43 percent); and to 700 in Delaware (-17 percent).
The views expressed here do not necessarily represent the views of the Federal Reserve Bank of Philadelphia or the Federal Reserve System.
[1]Annual figures reflect the number of children in foster care on September 30. Ratios for Alaska and Hawaii, which are not depicted cartographically, were 8.8 and 3.0, respectively.
Sources: Author’s calculations using Adoption and Foster Care Analysis and Reporting System (AFCARS) data produced by the Children’s Bureau, Administration for Children & Families, U.S. Department of Health and Human Services; U.S. Census Bureau, 2013 American Community Survey, Table B01001; ESRI, derived from Tele Atlas