

Although the average income of older Americans has grown rapidly over the past few decades, many seniors continue to struggle financially. Based on data from the American Community Survey and the Consumer Expenditure Survey, 14 percent of older adults — 6.5 million people in 2013 — do not have enough income to meet their needs. Most of their income comes from Social Security, and they spend much of it on housing.
Who Receives Inadequate Income at Older Ages?
Older adults have made tremendous financial gains over the past generation. Between 1966 and 2013, the official poverty rate for adults ages 65 and older fell from 29 percent to 10 percent, a nearly two-thirds reduction. Over the same period, the poverty rate increased 27 percent for adults ages 18 to 64 and 11 percent for children younger than 18. Children are now twice as likely as older adults to live in poverty.
The U.S. Census Bureau recently developed the supplemental poverty measure (SPM) that better gauges the number of families with inadequate incomes. Like the official measure, the SPM identifies families whose incomes fall below a specified needs threshold. But it expands the cash income measure to include noncash benefits, such as supplemental nutritional assistance, housing subsidies, and energy assistance. It also subtracts out-of-pocket medical expenses, work expenses, paid child support, and taxes, while adding tax credits, such as the earned income tax credit. In addition, the SPM updates the poverty threshold to better reflect current household spending.
The SPM reduces the 2013 poverty rate for children from 19.9 percent to 16.4 percent; it raises the poverty rate for adults ages 18 to 64 from 13.6 percent to 15.4 percent and for adults ages 65 and older from 9.5 percent to 14.6 percent.
The share of older adults with inadequate incomes varies widely across the older population (Figure 1). More than 25 percent of older Hispanics, African Americans, and adults without high school diplomas did not have enough income in 2013 to meet their needs. The share of older adults with inadequate incomes rises with age, and older adults with disabilities — defined as having difficulty living independently — are more likely to have inadequate incomes than those without disabilities.
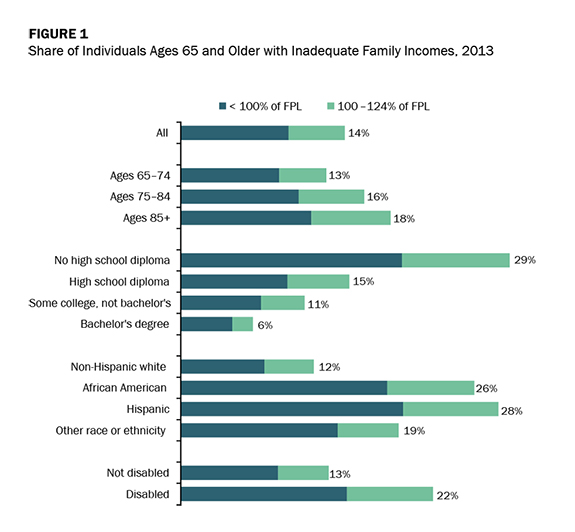
Figure 1. Share of older adults with inadequate incomes varies widely.
Source: Johnson’s estimates from the 2013 American Community Survey. Note: FPL = federal poverty level. From Richard W. Johnson, “Housing Costs and Financial Challenges for Low-Income Older Adults,” Research Report, Urban Institute, July 2015.
Women ages 65 and older are about 50 percent more likely to have inadequate incomes than their male counterparts. Divorced and widowed women face higher poverty risks in old age than married women because women who become divorced or widowed generally have lower incomes before their marriage ends than those whose marriages remain intact, and because women generally forfeit at least some of their husband’s income when the marriage ends.
Income Sources at Older Ages
Social Security is a crucial source of income for low-income older adults. In 2013, it accounted for 72 percent of the family income received by adults ages 65 and older with family incomes below 125 percent of the federal poverty level (FPL) (Figure 2). Supplemental Security Income, a government transfer program for low-income older adults and people with disabilities, accounted for another 9 percent of their income.
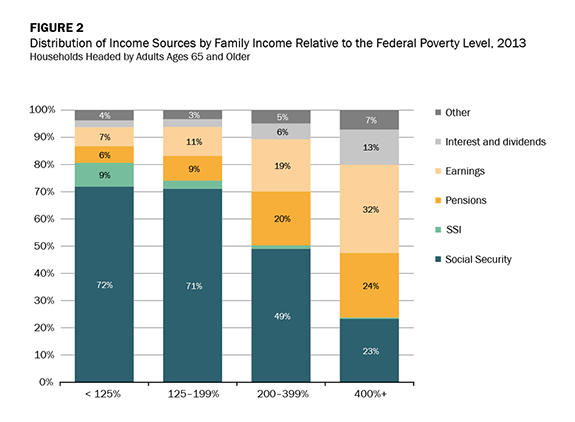
Figure 2. In 2013, Social Security accounted for 72 percent of family income received by adults ages 65 and older.
Source: Johnson’s estimates from the 2013 American Community Survey. Note: SSI = Supplemental Security Income. From Richard W. Johnson, “Housing Costs and Financial Challenges for Low-Income Older Adults,” Research Report, Urban Institute, July 2015.
Although low-income older adults receive most of their income from Social Security, their benefit amounts are low. Average annual Social Security income amounts to only $8,100 for adults ages 65 and older with family incomes below 125 percent of FPL, compared with $15,300 for those with family incomes between 125 and 199 percent of FPL and $19,600 for those with family incomes between 200 and 399 percent of FPL. Some retirees receive limited Social Security benefits because they collected their benefits early.
Low-income older adults receive little income from employer-sponsored pensions or investments. Few low-wage workers are able to accumulate enough savings to generate substantial interest and dividend income at older ages. In 2014, only 53 percent of workers, including 64 percent of full-time workers and 21 percent of part-time workers, participated in a retirement plan at their workplace, and relatively few workers with a retirement plan earned low wages. Only 33 percent of full-time workers earning less than $25,000 annually in 2010 participated in an employer-sponsored retirement plan, compared with 80 percent of full-time workers earning between $50,000 and $99,000 annually.
Household Spending at Older Ages
Adults use more health-care services at older ages than younger ages. Medicare helps pay for much of the medical care received by adults ages 65 and older, but most beneficiaries must pay substantial premiums for physician services and prescription drug coverage. Medicare also requires beneficiaries to share the cost of most services; does not cap annual out-of-pocket payments; and excludes some important services, such as long-term services and supports and routine dental and vision care.
The single greatest financial risk that older people face is the possibility of developing disabilities and needing long-term services and supports. This care is expensive and there are few financing options. The nationwide median cost of a year-long stay in a nursing home, in a semiprivate room, is $80,000; it is much higher in certain parts of the country. The nationwide median cost for an hour of homemaker services is $20, which translates to about $14,000 a year for someone who receives 60 hours of services a month, the median amount. Medicare does not usually pay for these services, and traditional health insurance doesn’t either. Private long-term care insurance usually pays, but only 12 percent of adults ages 65 and older have coverage. As a result, many older people who need long-term services and supports first turn to unpaid family help. When that’s not enough, they turn to paid home care and then enter a nursing home.
Although health-care costs attract most of the attention in discussions of older adults’ financial security, older people spend much more on housing, which includes shelter (mortgage interest and charges, property taxes, home maintenance and repairs, rent, and homeowners’ and renters’ insurance) and utilities. In 2013, households headed by adults ages 65 and older devoted 28 percent of their spending to housing — more than twice as much as they spent on health care (Figure 3). Older households also spent more on food and transportation than health care. Housing costs are especially significant for low-income older adults, who devoted 36 percent of their household expenditures to housing in 2013.
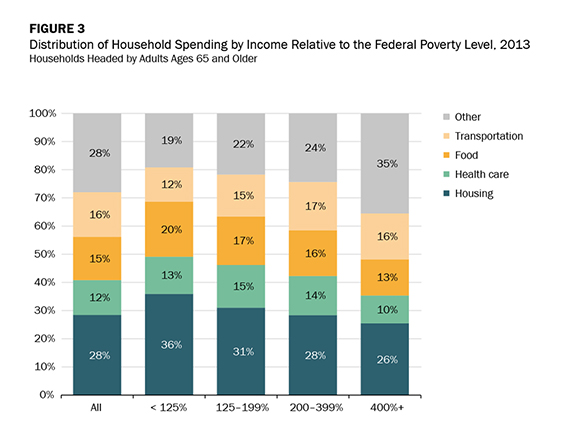
Figure 3. In 2013, households headed by adults ages 65 and older devoted 28 percent of their spending to housing.
Source: Johnson’s estimates from the 2013 Consumer Expenditure Survey. From Richard W. Johnson, “Housing Costs and Financial Challenges for Low-Income Older Adults,” Research Report, Urban Institute, July 2015.
Housing expenditures as a share of income are also high. Households headed by adults ages 65 and older spent 23 percent of their income on housing in 2013, including 8 percent on utilities (Figure 4). Eighty-one percent of older households own their homes, and 58 percent of older households (72 percent of homeowners) own their homes free and clear. Homeowners with mortgages spend $15,600 on housing costs, nearly twice as much as homeowners without mortgages. Renters spent $10,800 on housing, only about two-thirds as much as homeowners with mortgages. However, renters devote a much larger share of their income to housing than homeowners with mortgages, because, on average, they receive barely half as much income. In 2013, older renters spent 43 percent of their income on housing, substantially more than the 30 percent cutoff commonly used to identify burdensome housing costs.
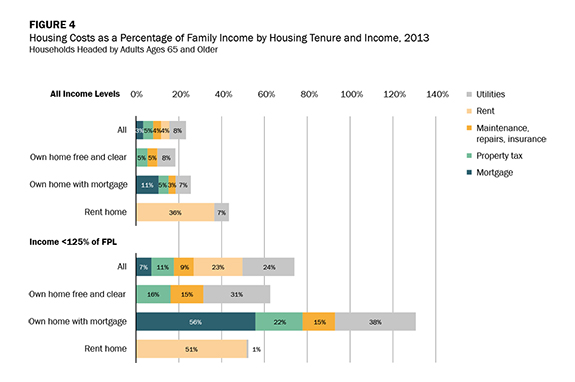
Figure 4. In 2013, households headed by adults ages 65 and older spent 23 percent of their income on housing.
Source: Johnson’s estimates from the 2013 Consumer Expenditure Survey. Notes: Family income is measured before taxes. FPL = federal poverty level. From Richard W. Johnson, “Housing Costs and Financial Challenges for Low-Income Older Adults,” Research Report, Urban Institute, July 2015.
Older households with incomes below 125 percent of FPL spent 74 percent of their income on housing in 2013. They were twice as likely to rent their home as all older households (38 percent versus 19 percent). Low-income older renters average only about half as much on rent a year as all older renters, but they devote a larger share of their income to housing costs — 52 percent — because their incomes are so much lower. Older low-income homeowners devote even more of their income to housing than older low-income renters. The 50 percent of older low-income households that own their homes free and clear spend 62 percent of their income on housing, and the 12 percent with mortgages spend a staggering 131 percent of their income on housing, forcing many to turn to family members for financial help. Low-income older homeowners with mortgages spend a slightly larger share of their income servicing their mortgage than renters spend on rent. But homeowners must also pay property taxes and maintenance and utilities expenses, which together cost more annually than their mortgage.
Conclusion
Older low-income adults rely mostly on Social Security, receiving little income from savings that they accumulated on their own or in the workplace. They devote much of their income to housing, even when they own their home free and clear, because utilities, maintenance, repairs, insurance, and property taxes cost about as much, on average, as rent. Low-income older households with mortgages spend even more on housing than renters and those who own their homes free and clear.
Housing costs can significantly reduce financial security at older ages. Seniors who spend more than half their income on housing spend significantly less on food and health care than their counterparts with lower housing expenses. The onset of mobility-limiting health problems at older ages creates additional housing-related financial concerns. To remain in their homes, seniors may need to make expensive home modifications, such as widening doorways or adding ramps to accommodate a wheelchair. Raising federal funding for housing with supportive services or expanding federal rental assistance, which now helps only one in four low-income renter households, could benefit many low-income older adults.
Policy initiatives aimed at helping families cover health-care expenses could also improve financial security at older ages. Although health-care costs consume only a modest share of older households’ income on average, some older adults with high medical or long-term care needs experience catastrophic costs. Policy options, such as capping out-of-pocket expenses for Medicare beneficiaries or creating a public insurance program to cover long-term services and supports, could protect older adults from these financial risks.
Other policy initiatives could boost retirement incomes. Because retirement incomes depend on earnings earlier in life, expanding employment opportunities for low-skilled workers, perhaps through better federally funded workforce development programs, could improve financial security at older ages. Efforts to promote savings, especially for workers without access to employer-sponsored retirement plans, might have long-term payoffs. The Obama administration recently created the myRA program, which allows workers without access to an employer retirement plan to contribute to a retirement account through automatic payroll deductions. Since 2012, 17 states have introduced or considered legislation that would mandate employer retirement plans, including automatic IRAs, for private-sector workers. Expanding the saver’s tax credit could also boost savings for people with limited resources. This federal program matches up to 50 percent of the first $2,000 in retirement savings by low-income adults. The government contribution, however, comes as a nonrefundable federal income tax credit and thus does not benefit savers who do not earn enough to pay federal taxes. Providing a refundable tax credit would provide additional savings incentives.
Probably the most important step that Congress could take to improve financial security at older ages is to shore up Social Security’s long-term finances, given the vital importance of the program to low-income seniors. Current projections indicate that, beginning in 2033, Social Security will not collect enough revenue to make full payments to beneficiaries. Instead, taxes would be sufficient to pay only about three-quarters of scheduled benefits. Congress could close the financing gap with higher taxes and trimmed benefits. However, it is important to protect the benefits of low-income beneficiaries. In fact, Congress might consider raising benefits for retirees with limited lifetime earnings, such as by instituting a meaningful minimum benefit in Social Security or expanding Supplemental Security Income.
For further information, contact Richard W. Johnson at rjohnson@urban.org.
The views expressed here do not necessarily represent the views of the Federal Reserve Bank of Philadelphia or the Federal Reserve System.
[1]Richard W. Johnson, “Housing Costs and Financial Challenges for Low-Income Older Adults,” Research Report, Urban Institute, July 2015, available at www.urban.org/research/publication/housing-costs-and-financial-challenges-low-income-older-adults/.