

Research by the Organisation for Economic Co-operation and Development (OECD) has shown that the last 30 years have seen people at the top of the economic ladder pulling away from those at the bottom. Today, the average income of the richest 10 percent in the OECD is around 9.5 times that of the poorest 10 percent, up from just 7 times 25 years ago.2 Over the same period, the Gini coefficient, a commonly used measure of inequality, increased on average by some 10 percent in 21 OECD countries, from 0.29 to 0.32.3
Trends in Inequality
Over the last two decades, income inequality has increased in most OECD countries as well as in countries outside the OECD area, including Indonesia, China, and South Africa (Figure 1). Patterns differ significantly across countries, however. What is striking is that even countries with traditionally low levels of inequality saw their Gini coefficient rise between the mid-1980s and 2013 — by 14 percent in Denmark and Norway, compared with 25 percent in Finland and 38 percent in Sweden.
Other countries with higher initial levels of inequality also experienced an increase: 18 percent in the United States, compared with 7 percent in Mexico. A handful of OECD countries saw little change in levels of inequality, including Belgium, the Netherlands, France, and Greece. In some emerging economies, like Brazil, income inequality dropped during these decades, but from much higher initial levels.
Figure 1: On average, income inequality increased across OECD countries
Gini coefficients of income inequality, mid-1980s and 2013, or latest date available
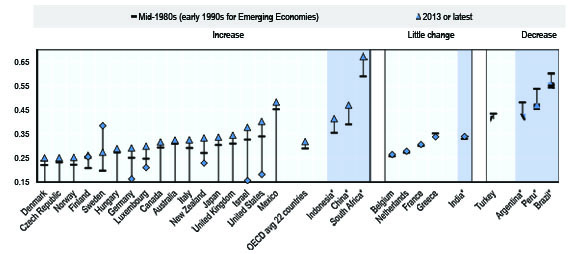
*Data for Argentina, Brazil, China, India, Indonesia, Peru, and South Africa (blue background) come from external sources and are not strictly comparable with the OECD Income Distribution Database data. The Gini coefficients are based on equivalized disposable incomes for OECD countries, and per capita incomes for other countries except India and Indonesia for which per capita consumption was used. Mid-1990s data for Peru and Indonesia refer to 1997 and 1996, respectively.
Notes: “Little change” in inequality refers to changes of less than 1.5 percentage points. Mid-1980s (early 1990s for emerging economies) refers to data from the period 1984–1986, with the following exceptions: 1983 for Belgium and Sweden, 1987 for Turkey, 1991 for Hungary, and 1992 for the Czech Republic. Data year for 2013 (or latest year): Data refer to 2014 for China; 2013 for Finland, Hungary, Netherlands, the United States, and India; 2011 for Canada, Chile, Israel, Turkey, and Brazil; 2010 for Indonesia; 2009 for Japan; and 2012 for the other countries. Also, equivalized disposable income is the total income of a household, after tax and other deductions, that is available for spending or saving, divided by the number of household members converted into equalized adults; household members are made equivalent by weighting each according to their age, using the so-called modified OECD equivalence scale. For more information, see http://ec.europa.eu/eurostat/statistics-explained/index.php/Glossary:Equivalised_disposable_income.
Source: OECD Income Distribution Database (IDD) (www.oecd.org/social/income-distribution-database.htm) for OECD countries; World Bank Poverty & Equity Data for India; National Socioeconomic Survey (SUSENAS) for Indonesia; Socio-Economic Database for Latin America and the Caribbean (SEDLAC) for Argentina, Brazil, and Peru; National Bureau of Statistics of China for China; and National Income Dynamics Study for South Africa.
In many places, the full extent of the growing chasm between rich and poor only truly becomes apparent higher up the income ladder. In the United States for instance, the share of pre-tax income going to the richest 1 percent has more than doubled since the 1980s, reaching almost 20 percent in 2012.4
The Costs of Inequality
These rising inequalities bear a cost on economic growth. Recent OECD evidence suggests that rising income inequality and slow long-term growth go hand-in-hand through their negative impact on employment opportunities and human capital5 accumulation by low-income families. And when persistent and entrenched inequalities prevent people from fulfilling their productive potential, there is a great loss of potential economic growth for society as a whole. The rise in inequality between 1985 and 2005 in 19 OECD countries enabled and even encouraged by pre-crisis economic approaches is estimated to have reduced cumulative growth by 4.7 percent between 1990 and 2010.6
Yet the full extent of the problem is greater still. Inequality is not just about income, but extends into every area of our lives. Rising disparity in income has been accompanied by greater polarization in education outcomes, health status, and opportunity in employment, and these components of multidimensional well-being are often interconnected. Data from 14 OECD countries show that, on average, people with better education live six years longer than their poorly educated peers.7
However, national averages can hide significant disparities in income inequality and well-being across cities within the same country. Among the 153 metropolitan areas in 11 OECD countries considered, the Gini coefficients of disposable income vary between 0.26 in Linz (Austria) to 0.5 in Tuxtla Gutiérrez (Mexico).8 Emerging OECD evidence suggests that larger cities tend to have higher levels of inequality: Cities like Copenhagen, Brussels, Paris, and Santiago all record the highest Gini coefficients in their respective countries (Figure 2).
Figure 2. Gini coefficients for household income in metropolitan areas, circa 2014
Metropolitan areas with minimum and maximum Gini coefficients, by country
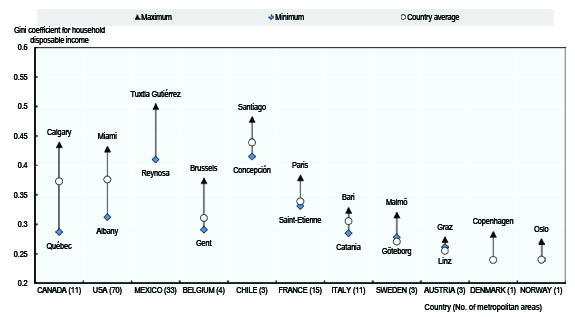
Note: The national values of the Gini index are estimated using the same data sources employed for the metropolitan areas. They might be slightly different from values provided by national surveys. Data do not allow the national Gini index for Mexico to be provided.
Source: OECD, Making Cities Work for All. Paris: OECD Publishing, 2016 (forthcoming).
Clearly, governments must move to address issues of inequality now, beginning where the need is most dire: in our cities.
Inequality in Our Cities
For the first time in history, the majority of people now live in cities, and 66 percent of the world population is expected to live in urban areas by 2050.9 Yet, these hubs of economic activity and population growth are exactly where inequality is often most prevalent. Income inequality is higher in urban areas than elsewhere, and unemployment has been increasingly concentrated in large cities.10
Likewise, inequalities remain within cities in terms of access to quality education. For example, in the Chicago metropolitan area, school districts’ high school graduation rates range from a low of 57 percent in the city of Chicago to over 95 percent in suburban areas.11 In terms of health, too, the pernicious effects of inequality are particularly pronounced in cities, with life expectancy differing by a staggering 20 years across neighborhoods in places such as Baltimore and London.
If we do not act now, the socioeconomic divides found in cities today threaten to continue to widen, stunting growth and sowing distrust in these places most crucial to growth.
The good news is that targeted policies aimed at increasing both income and non-income–based living standards broadly across all social groups — what the OECD calls inclusive growth — can make a big difference. Such policies recognize equality as a core driver of growth, viewing equality and growth as complementary, rather than opposing, forces.
The OECD Inclusive Growth in Cities Initiative
In order for such policy to be crafted and implemented, local leadership is crucial, as the effects of inequality are very region-specific. Informed knowledge of local conditions can help policymakers identify potential synergies among competing objectives in a certain region and manage any trade-offs. Local and regional governments control many policy levers for promoting prosperity, well-being, and inclusive growth, as they carry out around 40 percent of total public spending and 60 percent of public investment in the OECD.12 This is precisely why, in March 2016, with Mayor Bill de Blasio of New York City and 20 other mayors from around the world, the OECD, in collaboration with the Ford Foundation, launched the Inclusive Growth in Cities Initiative,13 a global coalition of Champion Mayors for Inclusive Growth that has grown to include 50 mayors worldwide.
Already, mayors have taken the lead in recognizing the need for inclusive growth in their communities. For example, as Champion Mayor Kasim Reed of Atlanta seeks to extend the benefits of his city’s tech growth to a more diverse set of residents, CodeStart — a partnership of a local incubator, the city’s workforce agency, and a coding school — is providing disconnected youth greater access to entrepreneurship through mentorship networks, critical thinking skills, hard coding abilities, and financial literacy training.
In Montreal, Champion Mayor Denis Coderre is investing in integrating the people who can often be among the most vulnerable and marginalized in city life: newly arrived immigrants. He announced in February 2016 his intention to invest $945,000 per year in the Bureau d’Intégration des Nouveaux Arrivants à Montréal (BINAM), a bureau dedicated to the welcome and integration of immigrants. The creation of the bureau was precipitated by the arrival of Syrian refugees to the city, and since then BINAM has been working to absorb new immigrants beginning with their arrival in Montreal all the way through to the point of integration, including services relating to cultural integration and educational facilitation.14
Philadelphia Mayor James Kenney has been taking action on inclusive education.15 In July 2016, Mayor Kenney designated the first nine “community schools” in Philadelphia — public schools in which a full-time coordinator works with the entire school community (students, parents, teachers, administrators, service providers, and neighbors) to identify the community’s most pressing needs. Those needs often include expanded medical services, after-school programming, and job training. The initiative recognizes that access to education is about so much more than just putting a student in school. By meeting the needs of the whole child and the neighborhood in which the child lives, community schools better support students and families to address nonacademic barriers to success in the classroom like violence, hunger, and homelessness. Mayor Kenney plans to develop up to 25 community schools over the next four years.
But previously, mayors such as Reed, Coderre, and Kenney who were making efforts toward inclusive growth had no forum through which to connect and exchange ideas. The Inclusive Growth in Cities Initiative seeks to bring these Champion Mayors together to enable city leaders to share their common resolve to make cities everywhere more inclusive.
This past March, 43 Champion Mayors signed on to the New York Proposal for Inclusive Growth,16 which outlined four critical policy domains to promote inclusive growth in cities: 1) education, 2) labor markets and skills, 3) housing and the urban environment, and 4) infrastructure and public services. In November, Champion Mayors will convene in Paris for a second meeting to release the Paris Action Plan, which will detail a series of actionable items inspired by the principles of the New York Proposal.
In the wake of an economic crisis that has revealed that the traditional approach of unbridled growth with no eye toward inclusivity erodes both economic prosperity and societal trust, we must ensure that we include people from all walks of life in our narrative of growth. The time for action is now, and the place for action is in our cities. We grow together, or not at all.
The views expressed here do not necessarily represent the views of the Federal Reserve Bank of Philadelphia or the Federal Reserve System.
[1The mission of the OECD is to promote policies that will improve the economic and social well-being of people around the world. The OECD provides a forum in which governments can work together to share experiences and seek solutions to common problems. The OECD works with governments to understand what drives economic, social, and environmental change, and measures productivity and global flows of trade and investment. The OECD analyzes and compares data to predict future trends and sets international standards on a wide range of things, from agriculture and tax to the safety of chemicals. With origins dating back to 1960, when 20 countries joined forces to create an organization dedicated to economic development, the OECD now has 35 member countries that span the globe.
[2]OECD and the Ford Foundation, All on Board: Making Inclusive Growth Happen. Paris: OECD Publishing, 2014, available at www.oecd.org/inclusive-growth/All-on-Board-Making-Inclusive-Growth-Happen.pdf.
[3]The Gini coefficient is a standard measure of inequality that measures the degree of concentration of income distribution within society. The Gini coefficient ranges from 0 (perfect equality) to 1 (all household disposable income going to one person); thus, the lower the Gini value, the more equal a society.
[4]Brian Keeley, Income Inequality: The Gap Between Rich and Poor. Paris: OECD Publishing, 2015, available at www.oecd-ilibrary.org/social-issues-migration-health/income-inequality_9789264246010-en.
[5]Includes the knowledge, skills, competencies, and attributes that allow people to contribute to their personal and social well-being.
[6]OECD, In It Together: Why Less Inequality Benefits All. Paris: OECD Publishing, 2015, available at www.oecd.org/social/in-it-together-why-less-inequality-benefits-all-9789264235120-en.htm.
[7]OECD, Health at a Glance 2013: OECD Indicators. Paris: OECD Publishing, 2013, available at www.oecd-ilibrary.org/social-issues-migration-health/health-at-a-glance-2013_health_glance-2013-en.
[8]OECD, Making Cities Work for All. Paris: OECD Publishing, 2016 (forthcoming).
[9]United Nations, “World’s Population Increasingly Urban with More Than Half Living in Urban Areas,” UN News Center, July 10, 2014, available at www.un.org/en/development/desa/news/population/world-urbanization-prospects-2014.html.
[10]OECD and the Ford Foundation, All on Board: Making Inclusive Growth Happen. Paris: OECD Publishing, 2014, available at www.oecd.org/inclusive-growth/All-on-Board-Making-Inclusive-Growth-Happen.pdf.
[11]OECD, “The Productivity-Inclusiveness Nexus: Meeting of the OECD Council at Ministerial Level,” Report, OECD, 2016, available at www.oecd.org/global-forum-productivity/library/The-Productivity-Inclusiveness-Nexus-Preliminary.pdf.
[12]OECD, OECD Regions at a Glance 2016. Paris: OECD Publishing, 2016, available at www.oecd-ilibrary.org/governance/oecd-regions-at-a-glance-2016_reg_glance-2016-en.
[13]See www.oecd.org/inclusive-growth/.
[14]OECD and Local Economic and Employment Development Programme (LEED), Montréal Métropole De Talent: Pistes D'Action Pour Améliorer L'Emploi, L'Innovation, et les Compétences. Paris: OECD Publishing, 2016.
[15]Mayor Kenney has been invited to join the global coalition of Champion Mayors for Inclusive Growth.
[16]See http://www.oecd-inclusive.com/wp-content/uploads/2019/05/New-York-Proposal.pdf.