

Public debate about pre-K programs has often focused on the issue of effectiveness. However, research data2 obtained from randomized control trials and from existing programs have shown that high-quality pre-K programs can be effective. This article provides an overview of the implementation of pre-K programs across the nation and in Pennsylvania.
When asked about possible areas for opportunity or innovation in high-quality pre-K programs, Donna Cooper, executive director of Public Citizens for Children and Youth (PCCY), said that “High-quality pre-K in itself is innovative.” In other words, high-quality pre-K is distinct from ordinary child care and is an effective method for increasing the well-being of children, especially children from low- to moderate-income communities. Cooper continued, “Despite the fact that this has been a 35-year conversation in America, it is finally becoming a conversation about scale.” Research demonstrating the effectiveness of high-quality pre-K has made it difficult, according to Cooper, for legislators opposed to pre-K to deny funding with rhetorical questions about effectiveness.
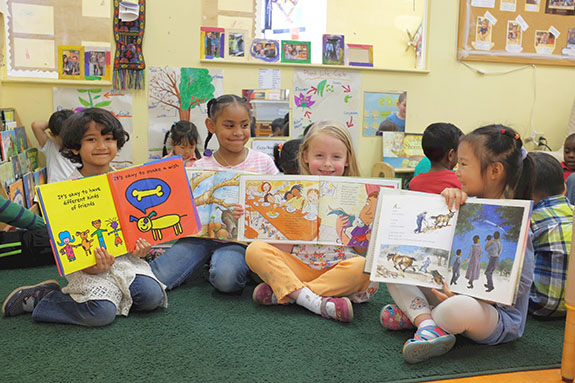
Children participate in a pre-K program at the Parent Infant Center in West Philadelphia this past summer.
Photo Credit: Public Citizens for Children and Youth
National Pre-K Trends
The State of Preschool 2015: State Preschool Yearbook, produced by the National Institute for Early Education Research, a unit of Rutgers University, profiles state-funded pre-K programs in the U.S.3 According to the yearbook, the percentage of three-year-olds enrolled in state-funded programs rose from 4 percent to 5 percent from 2014 to 2015. In addition, the percentage of four-year-olds enrolled in state-funded programs increased from 28 percent to 29 percent during the same period. The lack of significant growth in enrollment is explained by the fact that some states have increased funding and expanded programs, whereas other states either have not increased funding or have reduced it. Additionally, funding in many states is not stable and dedicated. Thus, pre-K programs have a difficult time enrolling new students.
Nationally, total state funding for pre-K programs increased by 10 percent, adjusted for inflation, from 2014 to 2015, according to the yearbook. Funding allocated in the New York state budget accounts for two-thirds of this increase. Total state funding for pre-K programs is higher now, adjusted for inflation, than it was during the prerecession peak. Average state funding per student also rose 6.8 percent, from $4,202 to $4,489, during this period. New Jersey had the second highest state spending per student behind Washington, D.C., which has district programs comparable to state programs. Based on data in the yearbook, the following table presents metrics on Third District pre-K programs.
| National | Pennsylvania | New Jersey | Delaware | |||||
|---|---|---|---|---|---|---|---|---|
| 2010 | 2015 | 2010 | 2015 | 2010 | 2015 | 2010 | 2015 | |
| Three-Year-Olds Enrolled | 4% | 5% | 5% | 6% | 18% | 19% | n/a | n/a |
| Four-Year-Olds Enrolled |
28% | 29% | 17% | 12% | 27% | 29% | 7% | 8% |
| Average Spending Per Student | $4,712 | $4,489 | $6,634 | $5,630 | $11,578 | $12,149 | $6,795 | $7,100 |
| National Ranking of Accessibility for Three-Year-Olds | n/a | n/a | 13 | 15 | 2 | 5 | n/a | n/a |
| National Ranking of Accessibility for Four-Year-Olds | n/a | n/a | 24 | 30 | 17 | 19 | 32 | 33 |
| National Ranking of Total State Spending | n/a | n/a | 8 | 15 | 1 | 2 | 7 | 9 |
| National Ranking of All Reported Spending | n/a | n/a | 16 | 23 | 1 | 2 | 13 | 10 |
Source: Table compiled and arranged by the author using data obtained from W.S. Barnett, A.H. Friedman-Krauss, R.E. Gomez, et al.,The State of Preschool 2015: State Preschool Yearbook. New Brunswick, NJ: National Institute for Early Education Research, 2016, available at http://nieer.org/research/state-preschool-2015 and W. Steven Barnett, Dale J. Epstein, Megan E. Carolan, et al., The State of Preschool 2010: State Preschool Yearbook, New Brunswick, NJ: National Institute for Early Education Research, 2010, available at http://nieer.org/sites/nieer/files/yearbook.pdf. |
||||||||
Quality standards can vary between the different states as well as between different programs within the same state. According to the yearbook, from 2014 to 2015, more state-funded programs required higher standards of quality as a prerequisite for continued funding. The checklist used in the yearbook to measure minimum standards for quality includes metrics such as teacher degree and specialization, teacher support and preparation hours, maximum class size, staff-to-student ratios, access to screening and support services, and use of research-informed curricula.
Pre-K Trends in Pennsylvania
Cooper explained that PCCY and 12 other partner organizations formed a nonpartisan advocacy group called Pre-K for PA to “make pre-K a defining issue in the gubernatorial and state legislative races and cause candidates to make specific and ambitious commitments to universal access to pre-K.” Cooper said that the campaign was able to garner the support of candidates in part because polls of voters showed strong public support for pre-K programs.4
Pre-K for PA bolstered public support by raising awareness of research that concludes that high-quality pre-K strengthens the academic performance and social skills of students in Pennsylvania,5 reduces the likelihood that a student will be arrested for a violent crime,6 and has the potential to bolster economic development in the state by generating $1.79 of spending for every dollar that the state invests in pre-K programs.7 Cooper also noted that “Research is causing a public debate, shifting investment decisions, and creating a feedback loop to ensure fidelity and performance.”
There is a real need to increase access and enrollment in pre-K programs in Pennsylvania. According to Cooper, only about 20 percent of the children in low- to moderate-income households in the state are enrolled in high-quality pre-K. That means that approximately 80 percent of the children who stand to benefit the most are left unserved or underserved by current programs.
Pennsylvania data on funding and enrollment show mostly negative trends. Between 2010 and 2015, total student enrollment in state-funded pre-K decreased for four-year-olds (from 17 percent to 12 percent) and increased modestly for three-year-olds (from 5 percent to 6 percent).8
State spending per student fell between 2010 and 2015, from roughly $6,634 to $5,630. The average state spending per student in 2015, which was $5,630, was less than the average spending per student in the federal Head Start program in Pennsylvania, which was $8,445.9 On the other hand, Governor Tom Wolf and the state legislature increased funding for pre-K programs by $30 million per year for the next two years.10
There are four state-funded pre-K programs in Pennsylvania: Pennsylvania Pre-K Counts, Pennsylvania Head Start Supplemental Assistance, the Ready to Learn Block Grant, and Pennsylvania School-Based Prekindergarten. The 2016–2017 budget provides for increases of 20.4 percent for the state’s Pre-K Counts program and 11.3 percent for the Head Start Supplemental Assistance program, which provides state funding to increase enrollment and services at federally funded Head Start programs in Pennsylvania.11
In 2015, according to the yearbook, Pennsylvania’s Head Start Supplemental Assistance program met nine of 10 of the minimum standards for quality, compared with eight in 2010. Pre-K Counts met seven minimum standards, the Ready to Learn Block Grant met five, and the School-Based Prekindergarten program met three minimum standards for quality in 2015.
Cooper pointed out that the quality standards set for state-funded programs are being refined. According to Cooper, Pennsylvania’s standards tend to be broad and have many requirements, but revisions of the standards will focus on a few factors that research has shown to be significant in producing positive results for students. For example, Cooper argues that a bachelor’s degree is an important metric for quality but is best used in conjunction with evaluations based on observations of teachers in the classroom.
Cooper and the Pre-K for PA campaign will continue to advocate refining quality standards and increasing access to high-quality pre-K programs. In addition to recent increases in funding, the campaign also led to the creation of the Early Childhood Education Caucus, which is chaired by Republicans and Democrats and is the largest bipartisan caucus in the state legislature.
School districts, Cooper explained, are adopting high-quality pre-K programs because they’ve found that it creates long-term savings by reducing spending for special education services. Special education, she said, is the “largest unfunded mandate in education.”
Cooper explained that Philadelphia School District leaders, with an eye toward sustaining early childhood gains, are “actively readying themselves on how to work with students who have highly developed cognitive, social and emotional, and motor skills.” By the end of the 2017–2018 school year, roughly 1,400 of the 2,100 teachers in the Philadelphia School District, according to Cooper, will have attended training on continuing the progress made in high-quality pre-K programs.
Conclusion
Despite the fact that research has shown the effectiveness of high-quality pre-K programs, many state-funded programs are not receiving the investment that is required to serve the children who stand to benefit the most. Pennsylvania has fallen behind on national rankings12 because funding has not kept pace with the increases seen in states that are leading the way on high-quality pre-K. However, Pennsylvania’s decline in national rankings predated the increases in funding recently signed into law. Public support, legislative action, and support from local school districts all demonstrate that the public debate about pre-K in Pennsylvania and across the nation has shifted emphasis from questions about effectiveness to questions about implementation.
The views expressed here do not necessarily represent the views of the Federal Reserve Bank of Philadelphia or the Federal Reserve System.
[1]See Rob Grunewald’s article “Investments in Young Children Yield High Public Returns” in this issue of Cascade.
[2]See James Heckman’s collection of resources, available at http://heckmanequation.org/search-results. See also the Pennsylvania Office of Child Development and Early Learning’s research, available at www.ocdelresearch.org/.
[3]W.S. Barnett, A.H. Friedman-Krauss, R.E. Gomez, et al.,The State of Preschool 2015: State Preschool Yearbook. New Brunswick, NJ: National Institute for Early Education Research, 2016, available at http://nieer.org/research/state-preschool-2015.
[4]Celinda Lake and Christine Matthews, “Where Do PA Voters Stand on Pre-K?” April 18, 2014, available at www.prekforpa.org/where-do-pa-voters-stand-on-pre-k/.
[5]See “Children’s Progress Update: Pennsylvania Pre-K Counts, 2012–13,” available at www.pakeys.org/uploadedContent/Docs/Early%20Learning%20Programs/PAPKC_progress_12-13.pdf.
[6]See Pre-K for PA and Fight Crime: Invest in Kids Pennsylvania, “Preschool Key to Cutting Pennsylvania Prison Costs and Boosting School Success,” 2016, available at www.prekforpa.org/wp-content/uploads/2016/06/PA-Im-the-Guy-Report-2016-final.pdf.
[7]See Sandra Bishop-Josef, Stephanie Schaefer, and Sara Watson, “Strengthening Pennsylvania Businesses Through Investments in Pre-Kindergarten,” Ready Nation/America’s Edge Pennsylvania, 2014, available at www.prekforpa.org/wp-content/uploads/2014/04/PA-Multiplier-Report-4-25-14.pdf.
[8]See W.S. Barnett and coauthors (2016), available at http://nieer.org/research/state-preschool-2015.
[9]See W.S. Barnett and coauthors (2016), available at http://nieer.org/research/state-preschool-2015.
[10]See “MEMO: Governor Wolf Secures Historic Increases to Education in 2016–17,” available at www.governor.pa.gov/governor-wolf-secures-increases-education-budget/.
[12]For more information, see http://nieer.org/publications/state-preschool-2010 and http://nieer.org/research/state-preschool-2015.