

Whether achieved through hard work and determination, an advanced education, entrepreneurism, skills improvement in the workplace, networking, or some combination thereof, the notion of intergenerational mobility is an important underpinning of a free market economy, and it’s part and parcel of the American dream.
Measuring Intergenerational Mobility
The concept of social mobility is the focus of recent research analyzing socioeconomic outcomes for children born in the early 1980s. Researchers compare the income of these children’s parents in the 1980s to the children’s household income today (as young adults) and find that social mobility in the U.S. is far from uniform throughout the country. Children who grow up in less-segregated communities with greater income equality, better K-12 schools, higher levels of social capital, and more stable families appear to be more upwardly mobile than children who grow up in communities without these characteristics.1
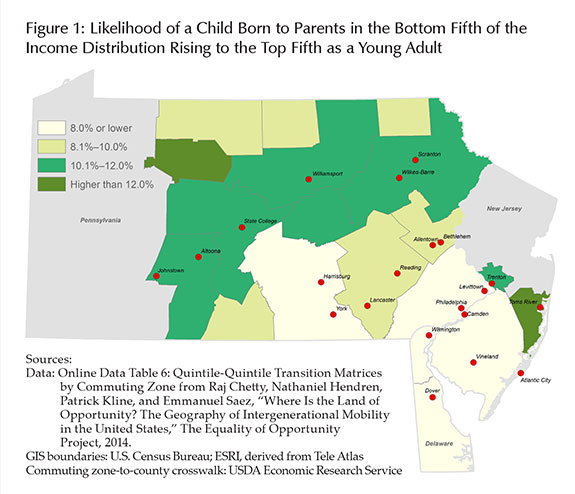
In a society with perfect social mobility, every child, regardless of parental or hometown characteristics, would have a 20 percent chance of occupying the top (or any) fifth of the income distribution as a young adult. Using data produced by this study for “commuting zones”2 in the Third District, Figure 1 shows the likelihood of a child born to parents in the bottom fifth of the income distribution rising to the top fifth as a young adult.
In the majority of regions in the Third District, this likelihood falls between 8 percent and 12 percent, with higher rates in Elk and Cameron counties on the western edge of the District and in Ocean and Monmouth counties in New Jersey.3 At the other end of the spectrum, the study suggests that children born into low-income families in south-central Pennsylvania, the Philadelphia region (including South Jersey), and Delaware have less than an 8 percent chance of attaining upper-income status.
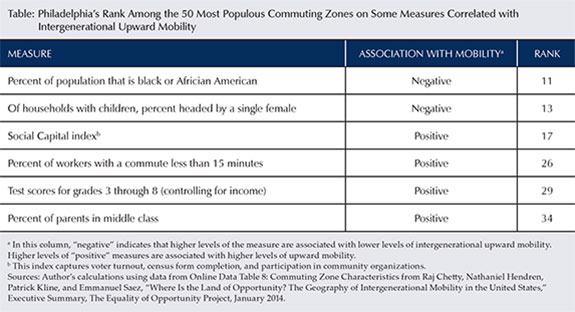
The likelihood illustrated for the District in Figure 1 ranges from 4.4 percent to 12.9 percent for the 50 largest commuting zones in the U.S. Philadelphia falls roughly in the middle of the pack (24th) at 7.4 percent. The table below shows Philadelphia’s rank among these 50 commuting zones on a handful of the measures included in this recent research that are shown to be correlated with social mobility (either positively or negatively). Philadelphia ranks highly on some characteristics associated with lower levels of social mobility (e.g., percent of households headed by a single mother) and places anywhere from 17th to 34th on some of the measures associated with higher rates of mobility.
Measuring Economic Growth
Most would agree that, regardless of one’s hometown or family income when growing up, a household is much more likely to be economically self-sufficient when its working members have access to a resilient, diversified, and growing job market. Ready access to job openings that match a wide array of educational levels, skills, and interests can provide a community’s residents with the opportunity to secure affordable housing, build wealth, and create a stable platform for their children’s future. At the municipal level, a vibrant economy can also form the backbone of a stable tax base, providing local governments with the fiscal capacity to create a quality of life that current residents enjoy and prospective residents seek.
A community’s economic strength, as well as its change over time, can be measured in a variety of ways. One common measurement is job growth. Figure 2 illustrates the percentage change in the number of jobs for commuting zones in the Third District between the first quarter of 2010 and the second quarter of 2013.4
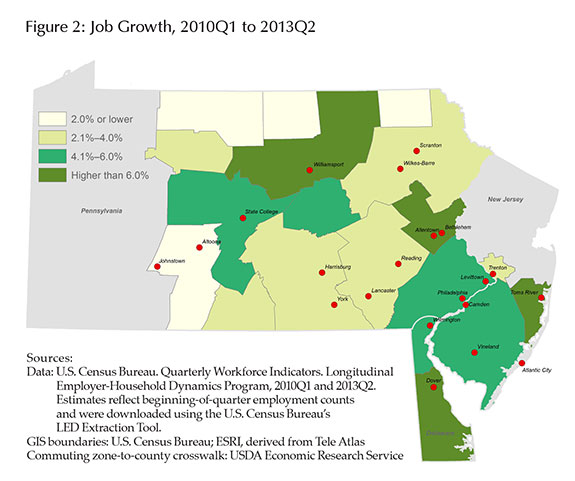
As Figure 2 indicates, a number of regions in the Third District have exhibited relatively strong job growth since the economic recovery began in 2010. On a percentage basis, the Lehigh Valley — as indicated on the map by Allentown and Bethlehem — has led the way with employment growth of nearly 9 percent. In absolute terms, however, the Philadelphia region is the real story, accounting for 128,000 new jobs, or 53 percent of all job growth in Third District counties over the period. It is noteworthy that areas such as the Philadelphia region and Delaware, identified in Figure 1 as having relatively low rates of social mobility, demonstrate relatively strong levels of employment growth in Figure 2.
A recent study analyzing metropolitan-level economic growth over the past two decades — using measures such as employment, gross metropolitan product, worker productivity, and income — finds that places with a low cost of doing business and high levels of education, innovation, self-employment, and entrepreneurship exhibited stronger economic growth than their counterparts.5 The same report also finds that “economic polarization,” as measured by factors such as income inequality, poverty, and crime, is positively associated with employment growth but negatively associated with income growth. In other words, economically polarized places are at an advantage in terms of job growth, but this success has not led to income gains for their residents. An emerging and exploratory body of research suggests that over the long term, economic growth may not be as strong where income inequality is high because some segments of the population lack the resources to make human capital investments — in education or other skills-building efforts — that could otherwise strengthen the economy.6
Making the Connection
The economic opportunities provided by a robust and growing job market are critical for both individual and communitywide financial success and stability, but they do not guarantee either one. Moving forward, the community and economic development fields must tackle a number of questions head-on, such as:
- What are the best ways to create stronger connections between local jobs and local job seekers in order to fully capture both the short- and long-term benefits of economic growth?
- Can traditional economic development strategies that prioritize job growth also incorporate equity as a parallel objective? Or do equity and inclusion require a different economic development paradigm?
- Do community characteristics such as income inequality influence the magnitude or duration of economic growth? If so, what are the mechanisms, and how large is the effect?
- How can educational systems best prepare students to fully take advantage of the economic opportunities that await them as adults?
These questions are as challenging to answer as they are important, which is why the department’s recent Reinventing Older Communities conference was dedicated to bridging growth and opportunity and why this issue of Cascade continues the conversation.
The views expressed here do not necessarily represent the views of the Federal Reserve Bank of Philadelphia or the Federal Reserve System.
[1]Raj Chetty, Nathaniel Hendren, Patrick Kline, and Emmanuel Saez, “Where Is the Land of Opportunity? The Geography of Intergenerational Mobility in the United States,” Executive Summary, The Equality of Opportunity Project, January 2014. The authors note that these factors are associated with higher levels of social mobility but are not necessarily causal in nature. Reports and downloadable data are available at The Equality of Opportunity Project; https://opportunityinsights.org/.
[2]Commuting zones are similar to metropolitan statistical areas but have the advantage of being geographically comprehensive because they include nonmetropolitan counties. Some of the counties in the Third District are included in commuting zones that lie primarily outside of the Third District. These commuting zone definitions are based on 1990 decennial census data.
[3]Although Monmouth County, New Jersey, is not included in the Third District, it is part of Ocean County’s commuting zone.
[4]The first quarter of 2010 is used as the starting point because it represents the quarter that the number of jobs in the United States reached its postrecession low, according to an analysis of Moody's Analytics employment data provided in the Brookings Institution’s “Metro Monitor — April 2014,” by Alec Friedhoff and Siddharth Kulkarni. The current version of this report is available at https://www.brookings.edu. This author’s analysis of Quarterly Census of Employment and Wages data from the Bureau of Labor Statistics reaches the same conclusion.
[5]Emily Garr Pacetti, “What Matters to Metros: Foundational Indicators for Economic Competitiveness,” Cleveland: Fund for Our Economic Future, 2013.
[6]See the literature reviewed in Emily Garr Pacetti’s “Growth and Opportunity: A Framework for Stronger, More Equitable Local and Regional Economies,” Cleveland: Fund for Our Economic Future, 2014.