

The housing choice voucher (HCV) program, sometimes referred to as Section 8 vouchers, is the largest housing assistance program funded by the U.S. Department of Housing and Urban Development (HUD), enabling over 2.2 million renter households across the country to access affordable, decent-quality rental units.1 Unlike project-based subsidies that make dedicated units available at below-market rents, the HCV program allows low-income households to select from units in the private rental market, subsidizing rents such that they do not exceed 30 percent of household income. In theory, the program enables households to access more opportunity-rich neighborhoods than would be attainable without assistance; however, researchers have extensively documented the underperformance of the program in this regard, particularly among voucher holders of color.2
Some scholars suggest that the way the program establishes rent ceilings has contributed to lackluster residential outcomes for participants.3 Each year, HUD publishes Fair Market Rents (FMRs), which serve as maximum rent levels for units of a given size. FMRs are typically calculated at the 40th percentile of market rents for units that meet certain quality standards.4 Historically, HUD has established FMRs at a regional level, meaning that voucher households in large metropolitan areas would be subject to the same rent cap across vastly different housing submarkets. As a result, many HCV households find units more attainable in relatively distressed neighborhoods with lower housing costs.5 To counteract this, in 2012, the agency began experimenting with Small Area FMRs (SAFMRs) that set rent ceilings at the zip code level. After promising early results in pilot communities,6 HUD issued a rule requiring housing authorities in 24 large metropolitan areas to implement SAFMRs in 2017, including those serving the Philadelphia–Camden–Wilmington metropolitan statistical area (Philadelphia MSA).
In August 2017, HUD announced a two-year delay for implementing the SAFMR program. Several civil rights organizations quickly challenged the delay in court. Although the substance of their complaint focused on procedural issues, the plaintiffs further argued that the delay violated the agency’s obligation under the Fair Housing Act and would have a disparate impact on African American and Hispanic voucher households, who often face the greatest barriers to accessing low-poverty neighborhoods. Although voucher holders are not considered a protected class under the federal Fair Housing Act,7 there is a long-established link between household-based rental assistance and housing desegregation efforts — several early voucher programs emerged from settlements of housing discrimination lawsuits.8 In December 2017, the U.S. District Court for the District of Columbia granted an injunction against HUD, compelling it to move forward as planned with SAFMRs.9 In January 2018, the agency announced that the affected housing authorities would be expected to implement SAFMRs by April 1, 2018.10
To better understand SAFMRs’ potential to support fair housing goals, this article explores three pertinent questions:
- Who uses HCVs in the Philadelphia MSA?
- Where are HCV households in the Philadelphia MSA currently living?
- What higher-rent neighborhoods have become more financially attainable to HCV households as a result of SAFMRs?
Insights from the vast body of literature on the HCV program are incorporated to provide additional context.
Who Uses HCVs in the Philadelphia MSA?
|
Table 1 summarizes key demographic and economic characteristics of HCV households in the Philadelphia region, providing insight into why the program remains a salient issue for fair housing advocates. A substantial majority of HCV households in the region are headed by individuals who identify as black or African American, and more than eight out of 10 identify as racial or ethnic minorities, compared with half of renter households in the region overall. The median household income is somewhat below the federal poverty line for a family of two and roughly equivalent to the earnings of full-time, year-round employment at the Pennsylvania minimum wage. Almost half of HCV households have children under 18 present, compared with 37 percent of HUD-assisted households in the region overall. In light of recent research on the importance of neighborhood conditions for the economic mobility and psychological well-being of youth,11 this further motivates attention to these households’ residential outcomes.
Where Are HCV Households in the Philadelphia MSA Currently Living?
Figure 1. Number of HCV Households by Zip Code Tabulation Area (ZCTA), Philadelphia MSA, 2017
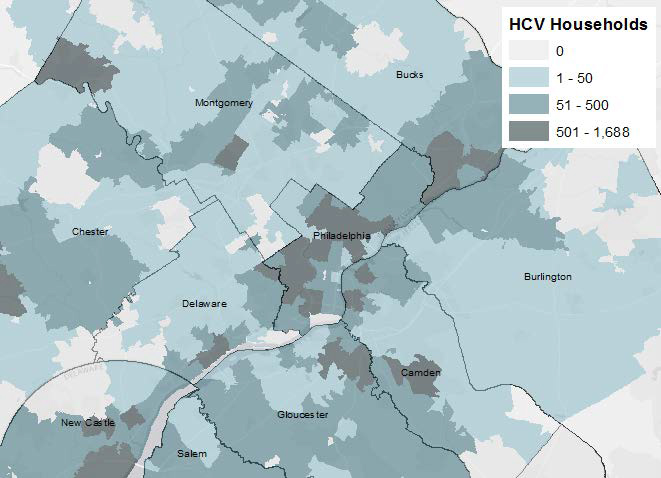
Source: U.S. Department of Housing and Urban Development Picture of Subsidized Households, UDS Mapper Zip Code to ZCTA Crosswalk, U.S. Census TIGER/Line Shapefiles Note: Excludes five HCV households residing in zip codes that could not be directly merged to ZCTAs. |
Figure 1 illustrates that HCV households can be found in the vast majority of zip codes12 in the Philadelphia region, although their concentration appears higher in a handful of areas. This is particularly true in the central cities of the MSA (Philadelphia; Wilmington, DE; and Camden, NJ), which account for 42% of the region’s occupied rental units but are home to 53% of its HCV households.13 By contrast, areas with few or no voucher households tend to be suburban communities. This within-region distribution of households is consistent with that of the nation.14
| HUD Program | Housing Choice Vouchers | Public Housing |
|---|---|---|
| Percent Minority | 64% | 78% |
| Poverty Rate | 25% | 37% |
Source: U.S. Department of Housing and Urban Development Picture of Assisted Households Note: Percent minority indicates the share of total population in census tracts where HCV households reside who identify as racial or ethnic minorities; poverty rate indicates the share of total population in census tracts where HCV households reside whose income was below the federal poverty level. | ||
It is worth examining the extent to which voucher holders live in segregated, high-poverty neighborhoods before the implementation of SAFMRs (Table 2). Like HCV households overall,15 Philadelphia-area voucher holders appear to access more diverse neighborhoods with lower poverty rates than do residents of public housing.16 However, this regional average may belie more troubling underlying patterns of socioeconomic segregation. HCV households in the city of Philadelphia, of which 90 percent are minority-headed, live in census tracts where 80 percent of residents identify as a racial or ethnic minority and where 32 percent of households have incomes below the poverty level. Existing research suggests that African American and Hispanic voucher households are more likely to be concentrated in moderate- to high-poverty inner-city neighborhoods17 than their white counterparts. Furthermore, African American HCV households in particular seem to have worse residential outcomes in regions that are already highly segregated,18 such as the Philadelphia MSA.19 Despite these racial disparities, nationally, African American and Hispanic HCV households actually tend to see greater relative improvements in neighborhood economic conditions from voucher-enabled moves compared with white HCV households.20 This mixed empirical picture helps illustrate both the promise and limitations of the HCV program thus far.
What Higher-Rent Neighborhoods Have Become More Financially Attainable to HCV Households as a Result of SAFMRs?
Figure 2. Comparison of 2018 SAFMR to Regional FMR by ZCTA, Philadelphia MSA, 2017
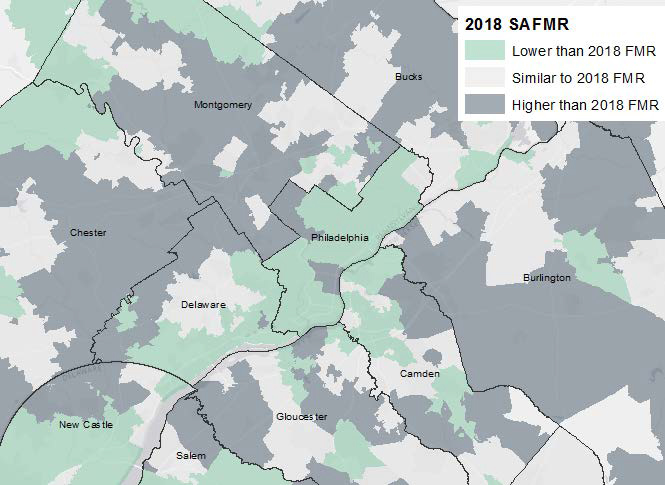
Source: Author’s calculation based on U.S. Department of Housing and Urban Development FY2018 Advisory Small Area FMR Lookup System, UDS Mapper Zip Code to ZCTA Crosswalk, U.S. Census TIGER/Line Shapefiles Notes: Lower than 2018 FMR indicates SAFMR <95% of regional FMR; similar to 2018 FMR indicates SAFMR 95%–105% of regional FMR; higher than 2018 FMR indicates SAFMR >105% of regional FMR. Excludes zip codes that could not be directly merged to ZCTAs. |
While it is too early to examine the impacts of SAFMRs in the Philadelphia MSA, we can begin to develop a picture of the likely impacts by examining which zip codes became more or less financially attainable with the introduction of SAFMRs. Figure 2 maps the difference between the 2018 regional FMR and SAFMRs for zip codes across the region. For simplicity, this analysis only examines differences for two-bedroom units, although it seems reasonable to assume that the direction and magnitude of differences within a zip code would be similar across unit sizes. A zip code is considered more financially attainable if its SAFMR is more than 5 percent higher than the regional FMR. Contrasting Figures 1 and 2, it is clear that the areas that have become more financially attainable to HCV households are areas in which few voucher holders currently live, as shown in Table 3.
| SAFMR: | Lower than FMR | Similar to FMR | Higher than FMR |
|---|---|---|---|
| Number of ZCTAs | 173 | 92 | 127 |
| HCV Households Residing in ZCTAs* |
34,898 (77%) | 7,432 (16%) | 3,275 (7%) |
| SAFMR Range, 2BR | $1,090–$1,200 | $1,210–$1,320 | $1,330–$1,750 |
| Median Household Income | $50,523 | $74,476 | $91,262 |
| Family Poverty Rate | 14.7% | 5.8% | 3.7% |
| Unemployment Rate | 10.3% | 6.8% | 5.5% |
| Percent Minority | 50.8% | 26.9% | 22.6% |
Source: Author’s calculations based on U.S. Census Bureau 2012–2016 American Community Survey (ACS), U.S. Department of Housing and Urban Development Picture of Subsidized Households 2017 and FY2018 Advisory Small Area FMR Lookup System, and UDS Mapper Zip Code to ZCTA Crosswalk * Excludes five HCV households residing in zip codes that could not be directly merged to ZCTAs. Does not sum to Philadelphia MSA total because of differences in ZCTA boundaries. Notes: Lower than FMR indicates SAFMR <95% of regional FMR; similar to FMR indicates SAFMR 95%–105% of regional FMR; higher than FMR indicates SAFMR >105% of regional FMR. Calculations exclude ZCTAs for which 2012–2016 ACS estimates were not available. Number of HCV households based on 2017 data. SAFMR ranges based on 2018 guidelines. All other characteristics pertain to the 2012–2016 period. Median household income, family poverty rate, unemployment rate, and percent minority are weighted ZCTA averages. Median household income and family poverty rate are household-weighted, unemployment rate is weighted by population ages 20–64, and percent minority is weighted by total population. | |||
Zip codes that have become more financially attainable — where the SAFMR is higher than the FMR — have considerably lower levels of poverty and unemployment than areas with lower SAFMRs, and they are less likely to be predominantly minority (Table 3). At face value, this analysis points to a strong potential for SAFMRs to expand voucher households’ access to more socioeconomically advantaged neighborhoods.21 Still, the existing evidence suggests that mobility-enhancing interventions may have a limited effect on racial and ethnic segregation.22 After all, the HCV program prior to the implementation of SAFMRs yielded disparate residential outcomes for white and minority HCV households.
Remaining Obstacles
Scholars have identified a variety of explanations for why voucher holders of color are less likely to move to low-poverty, racially integrated neighborhoods than may be expected. Sharkey identifies two types of constraints affecting low-income households’ residential mobility: structural constraints, which pertain to housing market characteristics and household economic resources, and cognitive constraints, which refers to how movers conceptualize which neighborhoods are available to them.23 Regardless of HCV use, low-income minority renters already face a wide range of structural constraints on their access to high-opportunity neighborhoods, including landlord bias, a limited supply of adequate and affordable rental units, travel and childcare costs associated with visiting units, upfront security deposit costs, and credit checks.24 Although HCVs partially alleviate household budgetary constraints, the program also requires that vouchers be used within a certain period of time after issuance,25 a requirement that may induce families to settle for less-than-ideal housing situations.26 Cognitive constraints arise from HCV households’ limited awareness of or information about residential opportunities in less distressed neighborhoods. These constraints may also be influenced by structural factors; for example, individual or community memories of housing discrimination can limit the range of neighborhoods that minority voucher holders consider in their housing search.27
Beyond structural and cognitive constraints, residential preferences likely play a role in the neighborhood choice of HCV households. Qualitative evidence suggests that low-income households heavily prioritize maintaining access to existing social supports during their housing searches, and many residents of distressed neighborhoods express deep connections to their communities.28 In fact, a substantial portion of voucher households end up leasing in the same neighborhood — or even the same unit — in which they lived before receiving HCVs.29 To the extent that neighborhood characteristics are considered in housing searches, they may be limited by transit accessibility and proximity to jobs and shopping,30 which are likely to be better in inner-city neighborhoods. Still, there is some evidence that exposure to neighborhoods with lower crime rates and higher-performing schools can influence HCV households’ residential preferences.31
Conclusion
There are good reasons to be optimistic about the impacts of SAFMRs on HCV households’ neighborhood options. Households in the HCV program already see improvements in residential outcomes relative to public housing residents, and early evaluations suggest that SAFMRs have the potential to further expand access to high-opportunity neighborhoods.32 However, the extent to which the HCV program can be effective at fostering broader desegregation remains to be seen. Assessing the potential of SAFMRs as a fair housing tool forces us to confront the complex realities that low-income households face in the private rental housing market, including structural and cognitive constraints beyond unit affordability. Furthermore, the value of social supports in HCV households’ current neighborhoods should not be underrated. Ultimately, this tension between fair housing objectives and HCV participant outcomes speaks to the ongoing need for both agency-enhancing mobility programs and quality-of-life-enhancing investments in distressed neighborhoods.
The views expressed here do not necessarily represent the views of the Federal Reserve Bank of Philadelphia or the Federal Reserve System.
[1]Author’s calculation based on U.S. Department of Housing and Urban Development Picture of Subsidized Households, 2017.
[2]Martha M. Galvez, 2010, “What Do We Know About Housing Choice Voucher Program Location Outcomes? A Review of Recent Literature.” What Works Collaborative, Washington, D.C.: Urban Institute; Kirk McClure, Alex F. Schwartz, and Lydia B. Taghavi, 2015, “Housing choice voucher location patterns a decade later,” Housing Policy Debate, 25 (2), 215–33; and Rolf Pendall, 2000, “Why voucher and certificate users live in distressed neighborhoods,” Housing Policy Debate, 11 (4), 881–910.
[3]Kirk McClure, 2013, “Which metropolitan areas work best for poverty deconcentration with housing choice vouchers?” Cityscape: A Journal of Policy Development and Research, 15 (3), pp. 209–36, and Pendall, “Why voucher and certificate users?”
[4]Since 2001, HUD has set the FMR in select areas, including the Philadelphia region, at the 50th percentile “to give lower-income families who participate in the voucher program access to a broader range of housing opportunities throughout a metropolitan area.” (66 FR 161)
[5]Stefanie DeLuca, Philip M. E. Garboden, and Peter Rosenblatt, 2013, “Segregating shelter: how housing policies shape the residential locations of low-income minority families,” The Annals of the American Academy of Political and Social Science, 647 (1), pp. 268–99.
[6]Robert Collinson and Peter Ganong, 2018, “How do changes in housing voucher design affect rent and neighborhood quality?” American Economic Journal 10 (1), pp. 62–89, and U.S. Department of Housing and Urban Development, 2017, “Small Area Fair Market Rent Demonstration Evaluation: Interim Report," Office of Policy Development and Research, Washington D.C. huduser.gov/portal/sites/default/files/pdf/SAFMR-Interim-Report.pdf.
[7]Some local jurisdictions, including the city of Philadelphia, ban housing discrimination based on source of income. However, a quick search by the author of “No Section 8” in rental listings on craigslist revealed that such discrimination remains commonplace. Though many jurisdictions fail to fully enforce these ordinances, there is some evidence that they improve voucher households’ access to higher-income neighborhoods (see Tighe, J. Rosie, Megan E. Hatch, and Joseph Mead, 2016, "Source of income discrimination and fair housing policy," Journal of Planning Literature, 32 (1), pp. 3–15).
[8]See Gautreaux v. Landrieu, 523 F. Supp. 665, 674 (N.D. Ill. 1981).
[9]Open Communities Alliance, et al. v. Carson et al., No. 17-2192 Document 29 (D. D. C. 2017), see ecf.dcd.uscourts.gov/cgi-bin/show_public_doc?2017cv2192-29 (accessed May 14, 2018).
[10]Notice PIH 2018-01, see hud.gov/sites/dfiles/PIH/documents/PIH-2018-01.pdf (accessed May 14, 2018).
[11]Raj Chetty, Nathaniel Hendren, and Lawrence F. Katz, 2016, “The effects of exposure to better neighborhoods on children: new evidence from the moving to opportunity experiment,” American Economic Review, 106 (4), 855–902; and Stefanie DeLuca, Susan Clampet-Lundquist, and Kathryn Edin, 2016, Coming of Age in the Other America, New York: Russell Sage Foundation.
[12]The boundaries used in Figures 1 and 2 and in the analysis in Table 3 are zip code tabulations areas (ZCTAs), a geography used by the U.S. Census Bureau that roughly corresponds to a zip code or collection of zip codes. (For more information, see www.census.gov/programs-surveys/geography/guidance/geo-areas/zctas.html.) For this analysis, zip codes were crosswalked to ZCTAs using a relationship file provided by UDS Mapper.
[13]Author’s calculation based on U.S. Census Bureau 2012–2016 American Community Survey and U.S. Department of Housing and Urban Development Picture of Subsidized Households, 2017.
[14]Galvez, “What do we know?” and McClure, Schwartz, and Taghavi, “Housing choice voucher location patterns.”
[15]Galvez, “What do we know?”
[16]It is worth noting that the poverty rate in HCV households’ neighborhoods is still nearly double that of the region; according to the 2012–2016 American Community Survey, 12.9% of households in the Philadelphia MSA had incomes below the poverty level.
[17]Galvez, “What do we know?”; McClure, Schwartz, and Taghavi, “Housing choice voucher location patterns”; and Pendall, “Why voucher and certificate users?”
[18]Keren Mertens Horn, Ingrid Gould Ellen, and Amy Ellen Schwartz, 2014, “Do housing choice voucher holders live near good schools?” Journal of Housing Economics, 23, pp. 28–40 and McClure, “Which metropolitan areas?”
[19]According to the American Communities Project at Brown University, the white-black dissimilarity index for the Philadelphia MSA was 67 in 2010, meaning 67 percent of the members of one these racial groups would need to move in order to achieve an equal distribution. Index values above 60 are considered “very high.” See s4.ad.brown.edu/projects/diversity/segregation2010/msa.aspx?metroid=37980 (accessed May 11, 2018).
[20]Galvez, “What do we know?”
[21]Collinson and Ganong, “How do changes in housing voucher design?”
[22]Patrick Sharkey, 2012, “Residential mobility and the reproduction of unequal neighborhoods,” Cityscape: A Journal of Policy Development and Research, 14 (3), pp. 9–32.
[23]Sharkey, “Residential mobility.”
[24]DeLuca, Garboden, and Rosenblatt, “Segregating shelter”; Sharkey, “Residential mobility”; and Galvez, “What do we know?”
[25]The Philadelphia Housing Authority requires HCV households to obtain a unit within 120 days of receiving the voucher. See pha.phila.gov/housing/housing-choice-voucher/hcv-tenant-responsibilities.aspx (date accessed: May 21, 2018).
[26]DeLuca, Garboden, and Rosenblatt, “Segregating shelter”; and Galvez, “What do we know?”
[27]Sharkey, “Residential mobility.”
[28]Kimberly Skobba and Edward G. Goetz, 2013, “Mobility decisions of very low-income households," Cityscape: A Journal of Policy Development and Research, 15 (2), pp. 155–72; Rachel Garshick Kleit, Seungbeom Kang, and Corianne Payton Scally, 2016, “Why do housing mobility programs fail in moving households to better neighborhoods?” Housing Policy Debate, 26 (1), pp. 188–209; and Hayden Shelby, 2017, “Why Place Really Matters: A Qualitative Approach to Housing Preferences and Neighborhood Effects,” Housing Policy Debate, 27 (4), pp. 547–69.
[29]Galvez, “What do we know?”
[30]Skobba and Goetz, “Mobility decisions.”
[31]Jennifer Darrah and Stefanie DeLuca, 2014, “Living here has changed my whole perspective: How escaping inner-city poverty shapes neighborhood and housing choice," Journal of Policy Analysis and Management, 33 (2), pp. 350–84.
[32]Galvez, “What do we know?”; Collinson and Ganong, “How do changes in housing voucher design?”; and HUD, “Small area fair market rent demonstration.”