
In the more than 50 years since then, residents understand the challenges to integration through a new lens and remain passionate about creating a neighborhood of diversity and inclusion. A contemporary challenge to racial integration in Mt. Airy focuses on the concern that rising housing costs will lead to the displacement of current residents and will inhibit lower-income residents from moving into the neighborhood. A central concern of community leaders is that these market forces will exert a disproportionate impact across racial groups and will segregate a neighborhood whose residents value racial and class diversity. To what extent has the degree of racial integration in Mt. Airy changed since 1990, and how does that degree of neighborhood integration relate to that of the city as a whole?
To assess trends in neighborhood integration in Mt. Airy, a measure of residential segregation, known as multi-group entropy, was calculated for all Census block groups in Philadelphia.2 The entropy score is best characterized as a measure of the evenness with which racial groups are represented in a geographic area.3 Lower scores indicate low levels of racial integration and higher scores indicate the equal representation of all five racial groups: non-Hispanic white, non-Hispanic black, non-Hispanic Asian, Hispanic, and non-Hispanic other (including non-Hispanic reporting more than one race). Neighborhood and city entropy estimates are calculated as population-weighted averages of the individual block group entropy scores.
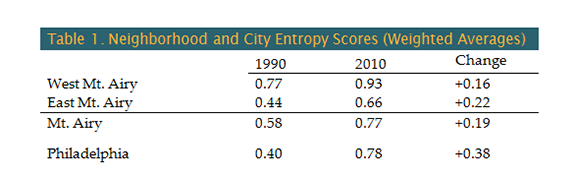
In 1990, the average entropy scores for both West (0.77) and East (0.44) Mt. Airy were greater than that for Philadelphia (0.40), indicating that block groups in the Mt. Airy neighborhood were in fact more racially integrated than those in Philadelphia as a whole (Table 1). Over the ensuing 20 years, however, as the city became more racially diverse, integration increased to a greater extent in Philadelphia than in Mt. Airy..4 Whereas the average entropy score for Philadelphia increased by 0.38, the score for Mt. Airy increased by only 0.19.
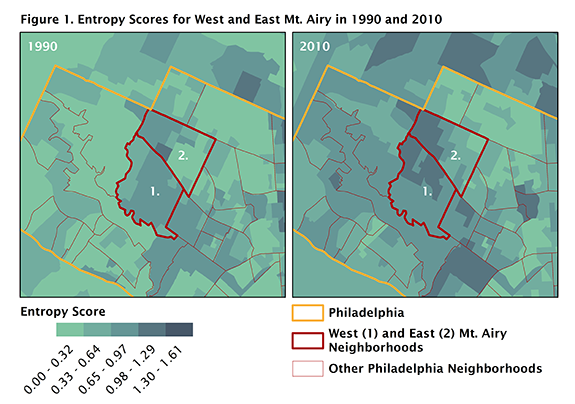
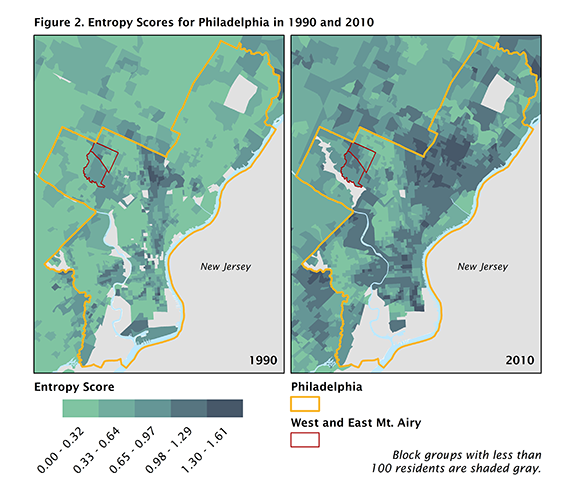
Yet, differences exist between East and West Mt. Airy. While West Mt. Airy became more racially diverse over this 20-year period and continues to be more integrated than the city overall, the eastern portion of East Mt. Airy remained segregated as a predominantly African-American neighborhood (Figure 1). Residential segregation also persists in other sections of Philadelphia, such as in North and West Philadelphia, whereas segregation has diminished substantially in Northeast Philadelphia (Figure 2).
The views expressed here do not necessarily represent the views of the Federal Reserve Bank of Philadelphia or the Federal Reserve System.
[1]Barbara Ferman, Theresa Singleton, and Don DeMarco, “Chapter 3: West Mount Airy, Philadelphia,” Cityscape 4:2 (1998), pp. 29–59; available at www.huduser.gov/Periodicals/CITYSCPE/VOL4NUM2/ch3.pdf; and Abigail Perkiss, Making Good Neighbors: Civil Rights, Liberalism, and Integration in Postwar Philadelphia. Ithaca: Cornell University Press, 2014.
[2]For details on the entropy calculation, see www.dartmouth.edu/~segregation/indicesofsegregation.pdf. Map and Data Sources: 1990 and 2010 U.S. Decennial Census data and related map layers obtained from the Minnesota Population Center. National Historical Geographic Information System: Version 11.0 [Database]. Minneapolis: University of Minnesota, 2016, www.nhgis.org. Neighborhood boundaries created by Azavea Inc. and accessed at OpenDataPhilly, www.opendataphilly.org/dataset/philadelphia-neighborhoods.
[3]Douglas Massey and Nancy Denton, “The Dimensions of Residential Segregation,” Social Forces 67:2 (1988), pp. 281–315.
[4]In this 20-year period, Philadelphia’s population decreased by about 60,000 residents, but the city as a whole became more diverse. Whereas more than half (52 percent) of Philadelphians were white in 1990, only 37 percent were white in 2010. In addition, the Asian population grew by 128 percent, the Hispanic population grew by 110 percent, and the African-American population grew by 3 percent.