
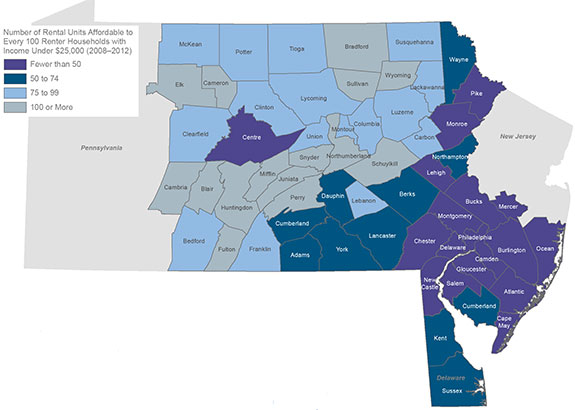
For households with the lowest incomes, it can be a challenge to find quality housing that meets this definition of affordability. Using data collected between 2008 and 2012, the map below shows the number of rental units affordable to every 100 renter households with incomes under $25,000. Monthly rent and utility costs for the units used to calculate this ratio were below $650.1
For counties in the Third District, there were roughly 58 affordable units for every 100 renter households in this income range. Deficits were greatest in southeastern Pennsylvania, southern New Jersey, and Delaware, while the ratio exceeded 100 in 15 counties in Pennsylvania.
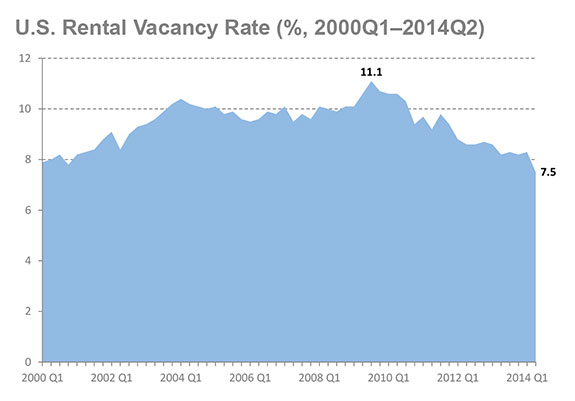
Falling vacancy rates can put upward pressure on rents. As the chart shows, the rental vacancy rate in the U.S. has fallen from over 11 percent to 7.5 percent in the past five years. The national rental vacancy rate has not been this low since the first quarter of 1997.
The views expressed here do not necessarily represent the views of the Federal Reserve Bank of Philadelphia or the Federal Reserve System.
[1]Monthly gross rent affordable to a household with an annual income of $25,000 is actually $625 ($25,000 divided by 12 months times 30 percent to arrive at affordable housing costs). However, because of the way that American Community Survey data are reported, this analysis includes units with gross rent below $650.
Sources: U.S. Census Bureau, 2008–2012 American Community Survey, Tables B25063 and B25118; U.S. Census Bureau, Current Population Survey/Housing Vacancy Survey, Series H-111, Table 1; ESRI, derived from Tele Atlas