

Research by the Federal Reserve Banks of Philadelphia and Atlanta examined CED grants disbursed to recipients in U.S. metro areas between 2008 and 2013, and identified characteristics that help to explain the ability of certain metro areas to attract more philanthropic funding than others.1 The authors examined grants for more traditional CED projects (e.g., housing rehabilitation, urban development, financial counseling, entrepreneurship), but also included a subset of grants for education, human services, health, and other projects consistent with the authors’ definition of CED as actions that "improve the economic situation of local residents and local businesses... and enhance the community's quality of life as a whole."2 Illustrating findings for metro areas located primarily in the Third Federal Reserve District, the map shows substantial variation in philanthropic support for CED activities ranging from $0.18 per capita in Williamsport, PA, to $54.33 per capita in Trenton–Ewing, NJ. Lebanon, PA, and Williamsport, PA, received the lowest per capita grant volume of the metro areas in the region, ranking eighth and third lowest amongst all metro areas in the nation, respectively.

Map source: U.S. Census Bureau.
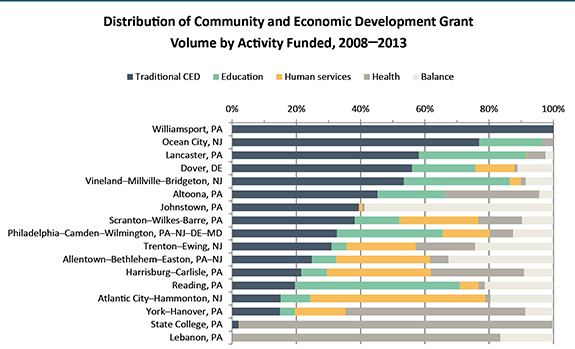
Among the 17 metro areas shown on the map, four types of activities received the greatest volume of CED grant funding: traditional CED (32 percent), education (29 percent), human services (16 percent), and health (10 percent). In fact, as shown in the bar chart, these four categories collectively captured at least 60 percent of each metro’s CED grant funding, with the exception of Johnstown, PA, where 49 percent was directed to public safety projects. Funding was disproportionately directed towards traditional CED activities (100 percent) in Williamsport, PA; education (51 percent) in Reading, PA; human services (54 percent) in Atlantic City, NJ; and health (98 percent and 84 percent) in State College, PA, and Lebanon, PA, respectively.
The views expressed here do not necessarily represent the views of the Federal Reserve Bank of Philadelphia or the Federal Reserve System.
[1]The figures and estimates provided in this article were derived from research that has been accepted for publication in the Foundation Review and will be made available online in the fall of 2016 at http://johnsoncenter.org/resources/thefoundationreview/. The full citation is Keith Wardrip, William Lambe, and Mels de Zeeuw, “Following the Money: An Analysis of Foundation Grantmaking for Community and Economic Development,” Foundation Review, 8 (Special Issue: Future of Community) (2016).
[2]Because of the scope of the data set acquired from the Foundation Center, Wardrip, Lambe, and de Zeeuw only considered grants of at least $10,000 from the nation’s largest 1,000 foundations; quote from Mihailo Temali, The Community Economic Development Handbook: Strategies and Tools to Revitalize Your Neighborhood. St. Paul: Amherst H. Wilder Foundation, 2002; quoted in Wardrip, Lambe, and de Zeeuw (2016).